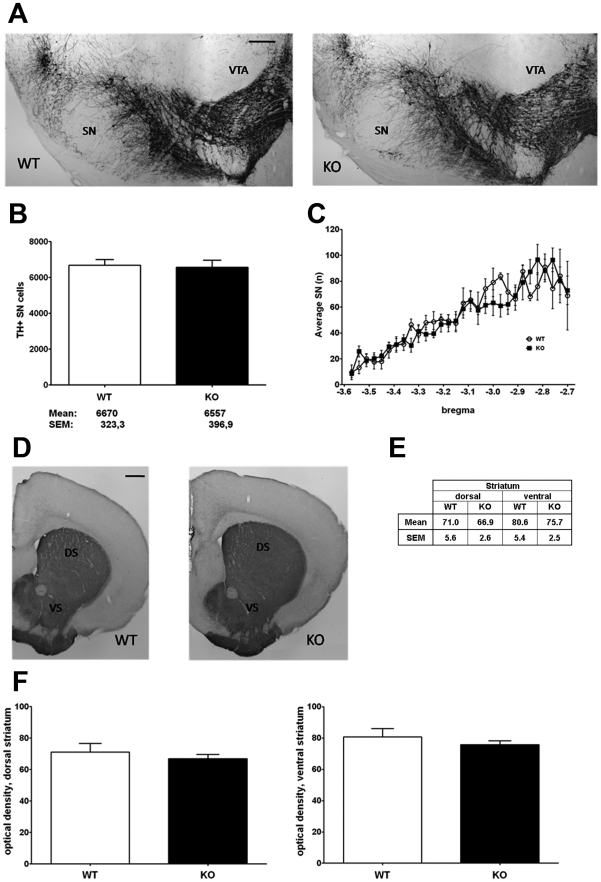
Figure 4. Aged Pink1 −/− brain does not display the typical signs of Parkinsonian neurodegeneration.
(A–C) Stereological counts of dopaminergic neurons in midbrain tissue: (A) Tyrosine hydroxylase (TH) immunostaining of wildtype (WT) and Pink1 −/− (KO) substantia nigra (SN) and ventral tegmental area (VTA) (scale bar, 200 µm). (B) Nonbiased stereological quantification of TH-immunopositive cells from WT (n = 5) and KO (n = 6) SN. The mean neuron count differed only by 113 cells. (C) Average number of unbiased sampled TH-immunopositive SN neurons in 30 serial midbrain sections, covering the caudo-rostral axis (bregma −3.8 to −3.2) in WT (n = 4) and KO (n = 6) mice. Note that there are no significant differences between the two graphs. (D–F) Optical density of dopaminergic nerve terminals in dorsal and ventral striatum: (D) TH immunostaining of striatal sections from WT and KO mice (scale bar, 500 µm). (E, F) Optical density quantification of TH immunostaining density of dorsal (DS) and ventral striatum (VS) from WT (n = 5) and KO (n = 6) mice. There were no significant differences in dorsal (mean WT 71.0, SEM 5.6; KO 66.9, SEM 2.6) and ventral striatum (WT 80.6, SEM 5.4; KO 75.7, SEM 2.5).

