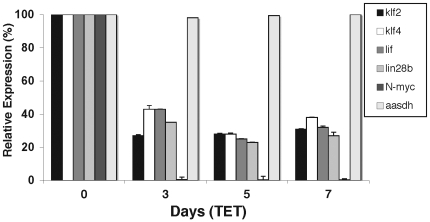
Figure 2. Expression of klf2, klf4, lif, and lin28b are linked to N-myc levels in human neuroblastoma.
qRT-PCR quantifies the changes in klf2, klf4, lif, and lin28b expression with similar 3–5 fold decreases in expression for each at each time point of Tet treatment (added daily). Error bars are standard deviation (S.D.) and where not evident it is because the S.D. is so low the bars are so small they do not show up. S.D. throughout this study were quite low and generally ranged from 0.5–5.5%. TET21N neuroblastoma were treated daily with Tet in this experiment. The data here were analyzed using the comparative Ct method, but then reanalyzed using the Pffafl method giving essentially identical results (Fig. S1).

