Figure 2.
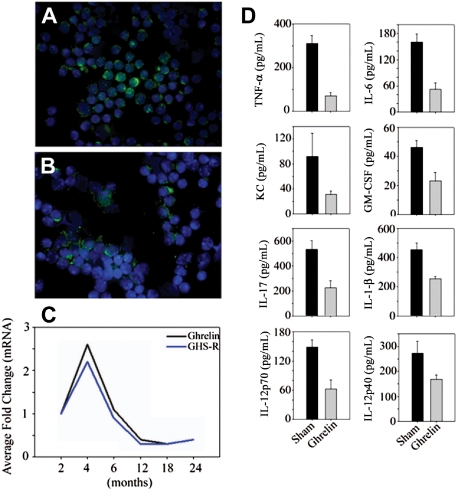
Age-related reduction in ghrelin expression and inflammation. Nonfractionated splenic T cells from (A) 2-month-old and (B) 24-month-old BALB/C mice were separated using negative selection and labeled with ghrelin; nuclei were counterstained with DAPI. (C) The ghrelin mRNA expression in spleen was studied by real-time PCR analysis. The threshold amplification values (Ct) of 4 to 6 mice per group were collapsed and normalized to GAPDH and are presented as fold change. (D) Ghrelin was infused at a concentration of 1.25 μg/hour (levels corresponding to fasting ghrelin peripheral concentration of young mice) for 2 weeks (n = 8), whereas control BALB/c mice were implanted with osmotic pumps containing the PBS vehicle alone. The circulating cytokines were measured using a bead based multiplex assay kit in serum of 20-month-old mice. In all cases, the differences between sham control– and ghrelin-treated mice were significantly different (P < .05). In contrast to the studies by Xia et al,21 we failed to observe any inhibition of T-cell proliferation or alterations in T-cell viability in response to ghrelin treatment that may account for the inhibitory effects of ghrelin on cell activation (data not shown).

