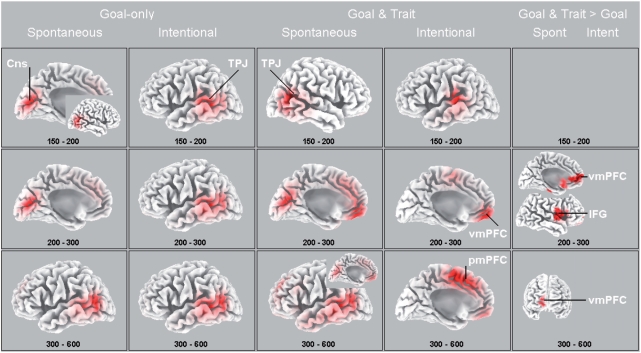
Fig. 2.
LORETA source analysis. Columns 1–2 depict the amplitudes of goal-only conditions under spontaneous and intentional instructions, and Columns 3–4 depict the goal + trait conditions under spontaneous and intentional instructions, all averaged during consecutive post-stimulus time segments. The maps are scaled with respect tot their minimum and maximum amplitude. The inset in Column 1 reveals that the TPJ is very active during this time interval as well (at least 1.4 µV more than in columns 2–4). The last column depicts maps of t-values with red areas indicating significantly greater activation under goal + trait > goal-only conditions under spontaneous (left, P < 0.05 uncorrected) and intentional instructions (right, all ns). The brain maps display either a medial view of the left hemisphere (oriented from posterior to anterior), a lateral view of the right hemisphere (oriented from posterior to anterior), a lateral view of the left hemisphere (oriented from anterior to posterior), or a frontal view (oriented from right to left). Talairach-coordinates (in x, y, z) of the highest significant differences between goal + trait > goal-only conditions for spontaneous instructions are at 200–300 ms: 4, 50, 8 (mPFC) and 60, 3, 8 (IFG); at 300–600 ms: 11, 66, 1 (mPFC). vmPFC = ventro-medial PFC; pmPFC = posterior medial PFC; for all other abbreviations see text.

