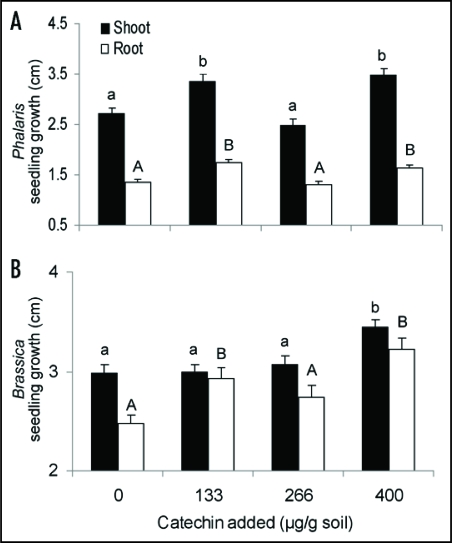
Figure 1.
Mean (+SE) shoot (black bar) and root (white bar) length of Phalaris minor (A) and Brassica campestris (B) in sterilized soil treated with 0, 133, 266 or 400 µg/g soil. Results from Inderjit et al.9 indicated that these application rates produced detectable concentrations of roughly 0, >1, 1–5 and 1–40 µg catechin/g soil. Shared letters indicate no significant differences among treatments and control as determined by one-way ANOVA with treatment as fixed variable, and post ANOVA Tukey test (p < 0.05).

