Figure 2.
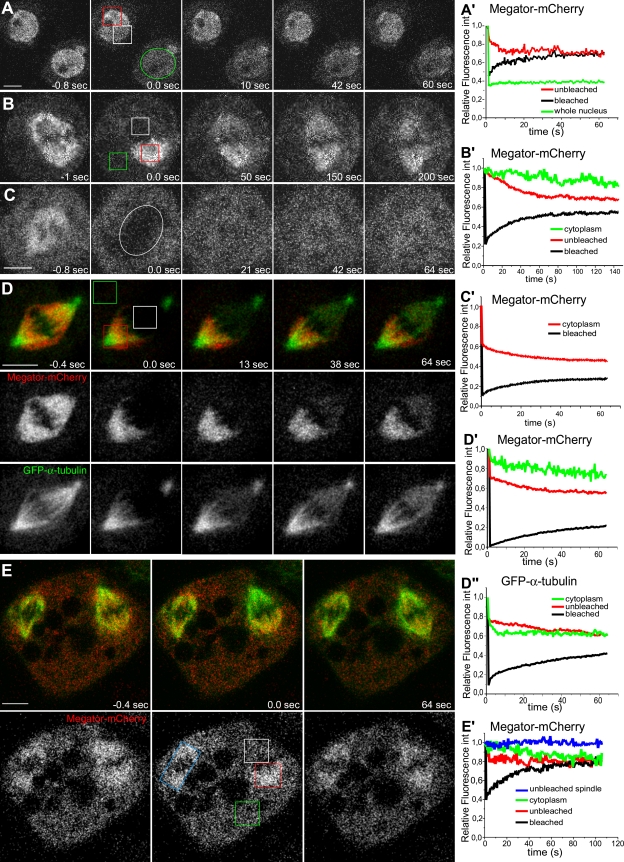
Analysis of Mtor-mCherry dynamics by FRAP. (A and A′) FRAP of Mtor-mCherry in interphase nuclei. The white ROI shows fluorescence recovery within a bleached region; the red ROI shows fluorescence loss from an equivalent unbleached region; and the green ROI shows the entire nuclear area bleached in a neighboring cell. (B and B′) FRAP of Mtor-mCherry in one half-spindle (white ROI) and respective fluorescence loss in the other half-spindle (red ROI). The green ROI shows cytoplasmic fluorescence decay. (C and C′) FRAP of Mtor-mCherry in the entire mitotic spindle (white circle). Fluorescence decay in an equivalent area in the cytoplasm is indicated in the graph. (D–D″) Simultaneous FRAP of Mtor-mCherry (red) and GFP–α-tubulin (green) in the mitotic spindle. The corresponding FRAP of Mtor-mCherry and GFP–α-tubulin (white ROI) in the half-spindle was measured and compared with fluorescence loss in the unbleached half-spindle (red ROI) and cytoplasm (green ROI). (E and E′) Cell with two spindles in which Mtor-mCherry was photobleached in one half-spindle (white ROI). FRAP of Mtor-mCherry in this half-spindle was measured and compared with fluorescence loss in the unbleached half-spindle (red ROI), in the entire unbleached spindle (blue ROI), and cytoplasm (green ROI). Time = 0 at first frame after photobleaching. Relative fluorescence int, relative fluorescence intensity. Bars, 5 µm.

