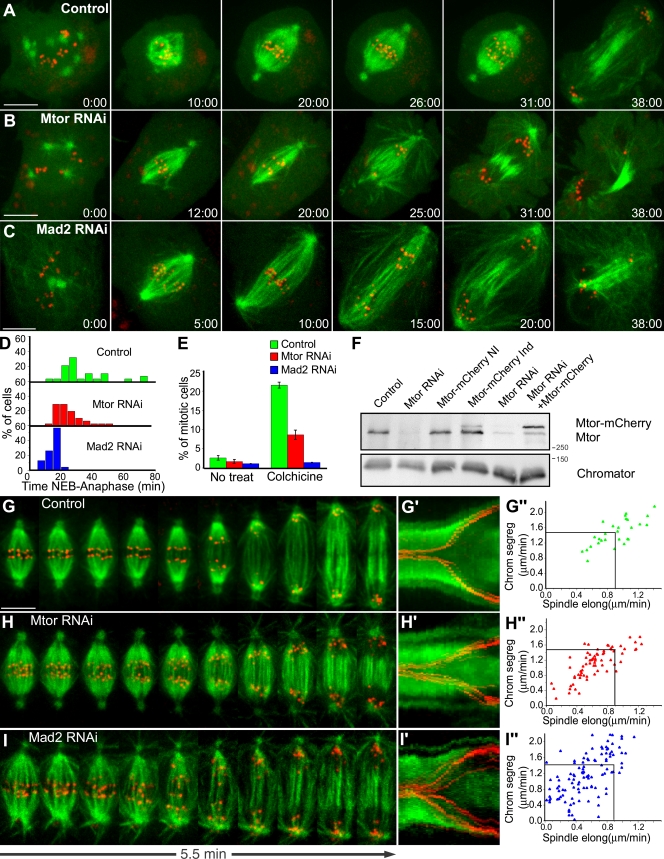
Figure 3.
Mtor is required for proper mitotic timing and SAC response. (A–C) S2 cells stably expressing GFP–α-tubulin (green) and CID-mCherry (red) were used for live imaging of mitotic progression in control (A), Mtor RNAi (B), and Mad2 RNAi (C). (D) Respective quantification of the time from NEB to anaphase. Mtor and Mad2 RNAi are statistically different from controls (P < 0.05; Dunn's test). Mtor is also statistically different from controls in a pairwise comparison (P = 0.003; Mann-Whitney test). (E) Mitotic index under physiological conditions or after colchicine treatment. Error bars represent SD from the mean obtained from three independent experiments. (F) Western blot analysis of Mtor. (left to right) Control, Mtor RNAi (75% depletion), stable expression of Mtor-mCherry without induction, stable expression of Mtor-mCherry after induction, RNAi using the 3′ UTR region of Mtor as target (86% depletion), and stable expression of Mtor-mCherry after induction and RNAi using the 3′ UTR region of Mtor as target. Chromator was used as loading control. (G–I) Analysis of chromosome and spindle dynamics during anaphase in control (G), Mtor RNAi (H), and Mad2 RNAi cells (I). (G′–I′) The corresponding kymograph analyses are shown. (G″–I″) Half-spindle elongation (spindle elong) and chromosome segregation (chrom segreg) velocities in control, Mtor RNAi, and Mad2 RNAi cells. Black lines indicate reference mean values for control cells. Spindle elongation in Mtor and Mad2 RNAi is statistically different from controls (P < 0.05; Student-Newman-Keuls Method). Time is shown in minutes/seconds. Bars, 5 µm.

