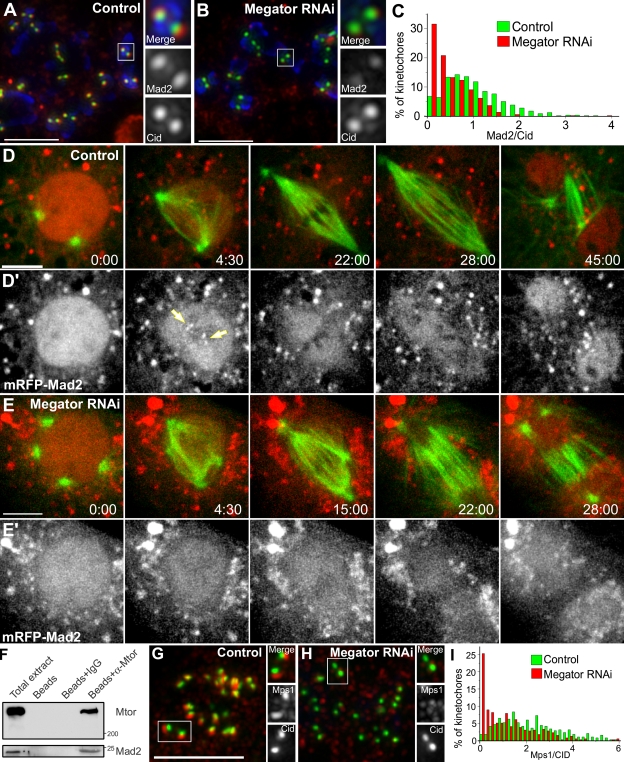
Figure 4.
Mad2 associates with and requires Mtor to localize to unattached KTs. (A and B) S2 cells treated with colchicine and processed for immunofluorescence with Mad2 (red) and CID (green) antibodies. DNA (blue) was counterstained with DAPI. (C) Quantification of Mad2/CID pixel intensity at KTs for control (median = 0.946, range = 0–5.52, n = 571 KTs/20 cells) and Mtor RNAi (median = 0.357, range = 0–3.95, n = 515 KTs/20 cells). The two populations are statistically different (P < 0.001; Mann-Whitney test). (D–E′) Mitotic progression in S2 cells stably expressing GFP–α-tubulin (green) and mRFP-Mad2 (red). Arrows indicate KTs. Red cytoplasmic aggregates likely correspond to misfolded mRFP-Mad2. (F and G) Control and Mtor RNAi cells were treated with colchicine and processed for immunofluorescence with Mps1 (red) and CID (green) antibodies. (H) Quantification of Mps1/CID pixel intensity at KTs for control (median = 2.06, range = 0.04–13.1, n = 384 KTs/20 cells) and Mtor RNAi (median = 0.91, range = 0–8.9, n = 391 KTs/20 cells). The two populations are statistically different (P < 0.001; Mann-Whitney test). (I) Co-IP of Mad2 with Mtor in lysates obtained from Drosophila embryos harvested between 0–3 h after egg laying. Time is given in minutes/seconds. Bars, 5 µm.

