Abstract
The effective control of tuberculosis (TB) has been thwarted by the need for prolonged, complex and potentially toxic drug regimens, by reliance on an inefficient vaccine and by the absence of biomarkers of clinical status. The promise of the genomics era for TB control is substantial, but has been hindered by the lack of a central repository that collects and integrates genomic and experimental data about this organism in a way that can be readily accessed and analyzed. The Tuberculosis Database (TBDB) is an integrated database providing access to TB genomic data and resources, relevant to the discovery and development of TB drugs, vaccines and biomarkers. The current release of TBDB houses genome sequence data and annotations for 28 different Mycobacterium tuberculosis strains and related bacteria. TBDB stores pre- and post-publication gene-expression data from M. tuberculosis and its close relatives. TBDB currently hosts data for nearly 1500 public tuberculosis microarrays and 260 arrays for Streptomyces. In addition, TBDB provides access to a suite of comparative genomics and microarray analysis software. By bringing together M. tuberculosis genome annotation and gene-expression data with a suite of analysis tools, TBDB (http://www.tbdb.org/) provides a unique discovery platform for TB research.
INTRODUCTION
In humans, tuberculosis (TB) is caused by the bacterium Mycobacterium tuberculosis and primarily targets the lungs (as pulmonary TB), but can also affect other organs, including the brain and meninges, lymph nodes, bone and joints, the genitourinary system and the intestine and liver. TB is today the second highest cause of death from infectious diseases after HIV/AIDS (1) and is the biggest killer of people infected with HIV (2). The World Health Organization's most recent global data (from 2005) show that every year 8 million people become ill with tuberculosis and 2 million people die of the disease. A third of the world's population has been exposed to TB, making this disease one of the greatest global health challenges facing us today (3). A remarkable feature of TB is its ability to enter an asymptomatic latent phase lasting years or even decades. Activation of a latent infection can be precipitated by changes in the physiological and immune status of the host owing to declining cell-mediated immunity associated with senescence, malnutrition and diabetes or the occurrence of other diseases, especially HIV/AIDS (4). Chemotherapy for active TB due to drug-sensitive strains entails the use of multiple antibiotics administered for 6 months. This complicated and frequently toxic treatment regimen often results in poor patient compliance. This in turn has led to the emergence of antibiotic resistant strains that require longer treatment courses, the use of less effective and more toxic drugs and higher failure rates (5). As a result, TB remains a widespread and deadly disease whose control will require more effective public health measures and the development of new drugs and vaccines. Recent developments in genomics and the availability of the complete M. tuberculosis genome sequence (6) has led to the use of genome-wide expression profiling and comparative genomics methods to better understand M. tuberculosis pathology, latency, emerging drug resistance and evolution. However, despite the wide-spread use of functional and comparative genomics to study M. tuberculosis, there has been no single repository for these large-scale datasets, complete with high-quality experimental annotation, and connected to up-to-date gene annotation and comparative genomic information. Instead, much of these data have been located in disparate sites like GenoMycDB: a database for comparative analysis of mycobacterial genes and genomes (7) and MGDD: M. tuberculosis genome divergence database (8) that employ diverse and often incompatible formats and analytical tools. The Tuberculosis Database (TBDB) was developed to address this gap. TBDB uses software from the Stanford Microarray Database (SMD) (9) and the Broad Institute's Calhoun system (10,11), and houses gene-expression data paired with genome sequence and annotation data. Uniting experimental data with genome sequence data enables researchers to ask complex questions and draw inferences that would otherwise be impossible by looking at individual small datasets. In this context, TBDB brings together powerful genomics tools to advance M. tuberculosis research in ways that will contribute to the identification of new drug targets, vaccine antigens, diagnostics and host biomarkers.
TBDB OVERVIEW
TBDB is an integrated database that houses both annotated genome sequence data and microarray and RT–PCR expression data from in vitro experiments and TB-infected tissues. TBDB houses genome sequence data for several M. tuberculosis strains as well as data for numerous related species. These data and annotations include publicly available sequences from a number of sequencing centers and groups, including sequences being produced by the Broad Institute's Microbial Sequencing Center. The microarray data within TBDB are predominantly from M. tuberculosis, but we are in the process of incorporating in vivo data from infected host tissues (principally human, primate and murine) into TBDB. Experimental data may be deposited into TBDB by any TB researcher prior to publication providing prepublication access to tools for the analysis, annotation, visualization and sharing of data. The data are then made public at the author's request or following publication, whichever is first. In addition, TBDB curators search the literature for publications containing relevant TB or host microarray data. The primary data are then requested from the authors of such publications and are entered into TBDB, where the experiments are annotated and made public so other researchers can reanalyze the data (often in conjunction with other datasets within TBDB) using TBDB tools. Table 1 lists TBDB statistics, including the number of annotated genomes in TBDB, microarray experiments, publications and other data types.
Table 1.
Summary of TBDB data content (as of September 2008)
| TBDB data statistics | |
|---|---|
| Number of genomes | 28 |
| Number of all microarrays | ∼5500 |
| Number of public microarrays | ∼1800 |
| Number of publications | 27 |
| Number of experiment sets | 160 |
The first route of entry into TBDB is the Quick Search feature, which allows a user to search all objects in TBDB by gene name, gene sequence name, author name, title or any other keyword. The result page of a Quick Search provides a count of genes, microarray experiments, operons, gene families and other database objects that match the query. Links from this results page provide direct access to pages with detailed information about particular objects, such as the Gene Detail and Publication pages. Quick Search is available at the top of every TBDB page, and thus provides an easily accessible single integrated access point to all genome annotation and expression data in TBDB.
TBDB GENOMES
TBDB currently houses genome sequence data for M. tuberculosis strain H37Rv (a standard prototype strain long used for experimental and animal infection studies), as well as other M. tuberculosis strains and bacteria from related taxa, focusing on members of the Actinomycetes family of high G+C content, Gram-positive organisms of which M. tuberculosis is a member. These genomes sequences have been annotated with a variety of genomic features including genes, operons, sequence similarity to GenBank sequences using BLAST (12), transfer RNAs using tRNAScan (13), protein domains and families using PFAM (14) and noncoding RNAs based on RFAM (15). Known immune epitopes have also been mapped through collaboration with BioHealthBase (16). A suite of analytical tools is also provided to allow comparative genomic analysis of M. tuberculosis. Table 2 lists the genomes in TBDB for which sequence data are available along with their size and the number of annotated genes. Access to the annotated genome sequences and comparative data is provided through several search interfaces, some of which are described subsequently.
Table 2.
List of annotated genomes in TBDB
| Organism | Size (mb) | Genes |
|---|---|---|
| M. tuberculosis H37Rv | 4.41 | 3999 |
| M. tuberculosis CDC1551 | 4.4 | 4189 |
| M. tb. F11 (finished) | 4.42 | 3959 |
| M. tb. C | 4.38 | 3851 |
| M. tb. Haarlem | 4.4 | 3866 |
| M. bovis AF2122/97 | 4.35 | 3920 |
| M. bovis BCG | 4.37 | 3952 |
| M. leprae TN | 3.27 | 1605 |
| M. avium 104 | 5.48 | 5120 |
| M. avium k10 | 4.83 | 4350 |
| M. smegmatis MC2 155 | 6.99 | 6716 |
| M. marinum | 6.64 | 5423 |
| M. ulcerans Agy99 | 5.63 | 4160 |
| M. vanbaalenii PYR-1 | 6.49 | 5979 |
| M. sp. KMS | 6.26 | 5975 |
| M. sp. MCS | 5.71 | 5391 |
| Rhodococcus sp. RHA1 | 9.7 | 9145 |
| Nocardia farcinica IFM 10152 | 6.02 | 5683 |
| Corynebacterium glutamicum ATCC 13032 | 3.28 | 3057 |
| C. diphtheriae NCTC 13129 | 2.49 | 2272 |
| C. efficiens YS-314 | 3.15 | 2950 |
| C. jeikeium K411 | 2.48 | 2120 |
| Streptomyces avermitilis MA-4680 | 9.12 | 7673 |
| S. coelicolor A3(2) | 8.67 | 7825 |
| Propionibacterium acnes KPA171202 | 2.56 | 2297 |
| Acidothermus cellulolyticus 11B | 2.44 | 2157 |
| Bifidobacterium longum NCC2705 | 2.26 | 1727 |
| Rhodobacter sphaeroides | 4.6 | 4242 |
Feature detail pages
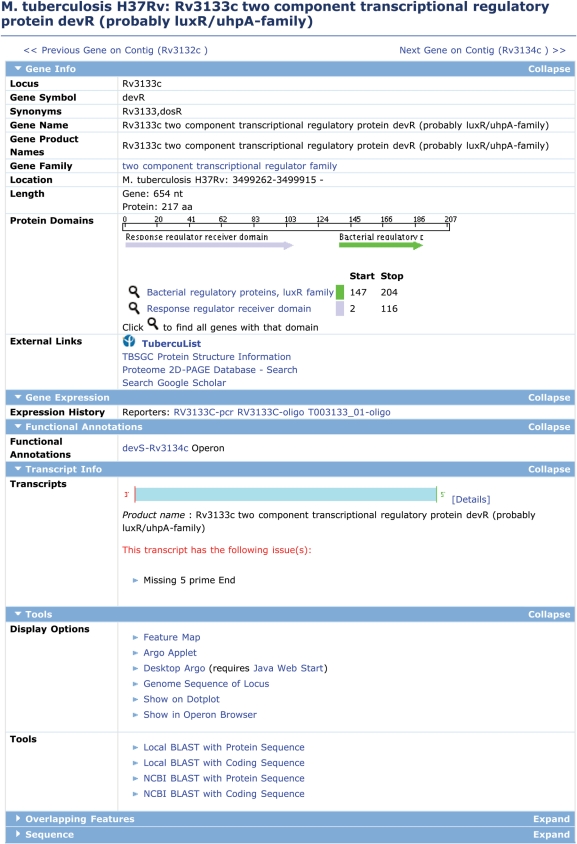
All information about annotated features on any genome sequence is available through Feature Detail pages, of which the Gene Detail page is the most common example (Figure 1). Information presented in the Gene Detail page is organized into different sections. These include, Gene Info, Gene Expression, Functional Annotation, Transcript Info, Sequence and genome display options. The Gene Info section provides complete details about Locus Name, Gene Symbol, Synonyms, Gene Name, Gene Product Names, Gene Family, Location, Protein Domains, External Links to related databases including TubercuList (17), TB Structural Genomics Consortium (TBSGC) Protein Structure Information (18) and the Proteome 2D-PAGE Database. Figure 1 shows the gene detail page for dosR (devR, Rv3133c), which encodes the response regulator of a two-component signal transduction system that tightly controls a well-studied M. tuberculosis regulon that is activated by oxygen limitation or exposure to nitric oxide (19).
Figure 1.
TBDB Gene Detail page. The Gene Detail page provides at-a-glance information for a given gene, including known names and synonyms, predicted function(s) and protein domains. It also serves as a jumping off point to various sequence tools, and to expression data for that gene. In addition, it provides several links to external resources such as TubercuList, TBSGC Protein Structure Information, Proteome 2D-PAGE Database at Max Planck Institute.
Genome visualization and comparative analysis
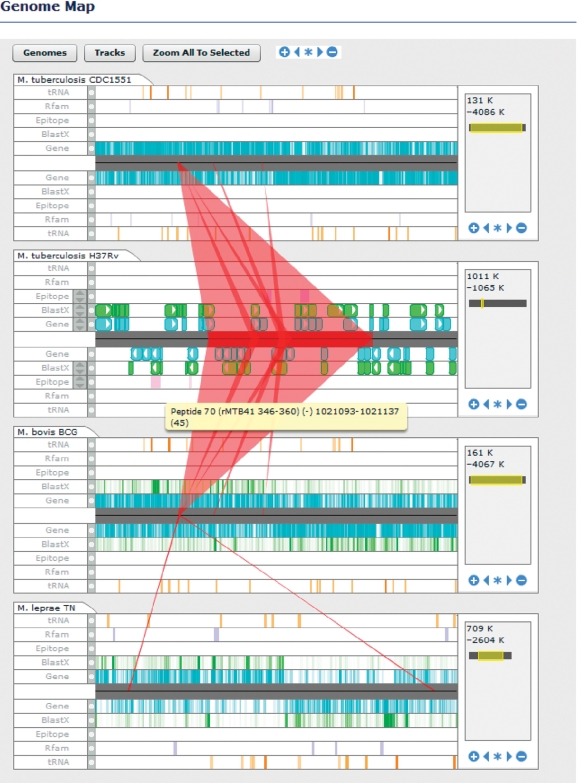
Researchers can retrieve DNA or protein sequence for segments of any of the genome sequences in TBDB from many locations within the site, including the Browse Regions search tool. The sequences can then be visualized using a number of different tools. The Argo Genome Browser (an interactive applet) and the Feature Map (a lighter weight version of the Argo Genome Browser) provide linear views of genome sequences along with all associated annotated features. Argo in particular provides a dynamic interface to visualizing genome data that allows users to zoom from whole chromosomes to individual nucleotides, navigate within sequences, and select individual features to retrieve additional information. A Circular Genome Viewer provides a circular plot of genome sequences along with a plot of the density of particular features, GC content and GC skew. Finally, the Genome Map tool provides a dynamic linear view of one or more genome sequences and associated annotations, and displays conserved synteny between the displayed genomes for regions selected by the user (Figure 2).
Figure 2.
Genome Map tool. This tool provides a linear view of one or more genome sequences and associated annotations as well as conserved synteny between genomes. Annotations are provided as tracks above (forward strand) and below (reverse strand) the midline. When zoomed out, annotations are viewed as density plots; when zoomed in individual features are displayed. Users may select regions of a genome sequence by dragging along the midline. Syntenic regions in the other sequences associated with the selection are then displayed as red bands.
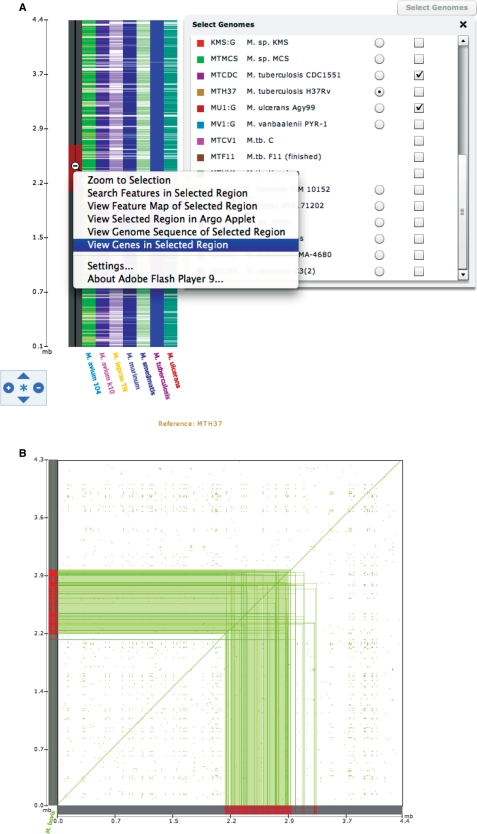
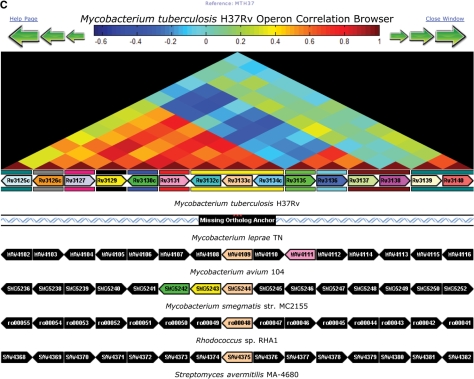
An additional number of tools are also provided specifically for comparative analyses between genome sequences, including the Synteny Map, Dot Plot, Operon Browser (Figure 3) and Gene Family Search. The Synteny Map uses precomputed genome alignments to graphically display regions of genomic similarity between a single reference genome and one or more other genomes—in effect providing the results of an in silico genome hybridization between sets of genomes. Using this tool, the user can select regions of interest and then click a region to zoom in and view genes, genome sequence, and features. The Dot Plot displays a navigable map of computed synteny between genomes in the form of dot-plot lines. When comparing multiple genomes, the color of the plotted synteny indicates which genome is aligned to the reference at that position. The Operon Browser is a tool that simultaneously displays the expression correlation between genes in a genomic region of the M. tuberculosis H37Rv strain while showing syntenic gene order of orthologs in related species. A heatmap derived from expression correlation data is provided along with an alignment of syntenic areas. Mousing over the genes provides additional information such as locus ID, gene symbol and description. Color coding of genes indicate orthologous relationships across different species. Finally, the Gene Family Search displays phylogenetic trees and sequence alignments of predicted orthologous gene families within the genome sequences in TBDB. The basic search feature lets the user choose the number of genomes to query and whether to limit the search to strict orthologs or not. In addition, an advanced search option chooses which genomes to include or exclude.
Figure 3.
Comparative genome analysis. The Genomes Synteny Map (A), Dot Plot (B) and Operon Map Browser (C) provide different ways to access comparative genomic data between M. tuberculosis reference genome and selected related species. These tools provide an interactive means to explore comparative genomic data.
TBDB GENE EXPRESSION DATA
TBDB houses public and prepublication microarray and RT–PCR expression data. Public data are freely accessible and can be downloaded or reanalyzed using TBDB analysis tools. Access to prepublication data is restricted to the researchers who generated the data until they publish or decide to make their data public. TBDB users can establish a free user account to enter microarray data, share prepublication microarray or RT–PCR data with colleagues or store datasets for analysis in a data repository. Data in the repository can be shared with other researchers at the discretion of the TBDB user.
Expression data in TBDB can be accessed by searching for data from individual microarrays or RT–PCR assays or by searching for data from a publication. For a novice user, the publication search is an easy place to start exploring expression data in TBDB. The expression Basic Search is an interactive search option that queries TBDB via publication, organism or dataset. The expression Advanced Search finds microarray data by experimenter, category, subcategory and organism. The Gene Search for Expression searches for genes or reporter sequences used on microarrays. Reporter sequences correspond to a piece of DNA deposited on a microarray slide. This search returns all microarray spots associated with a reporter sequence or gene, and the search results link to the Spot History page that lets users explore all associated microarray data.
Expression connection
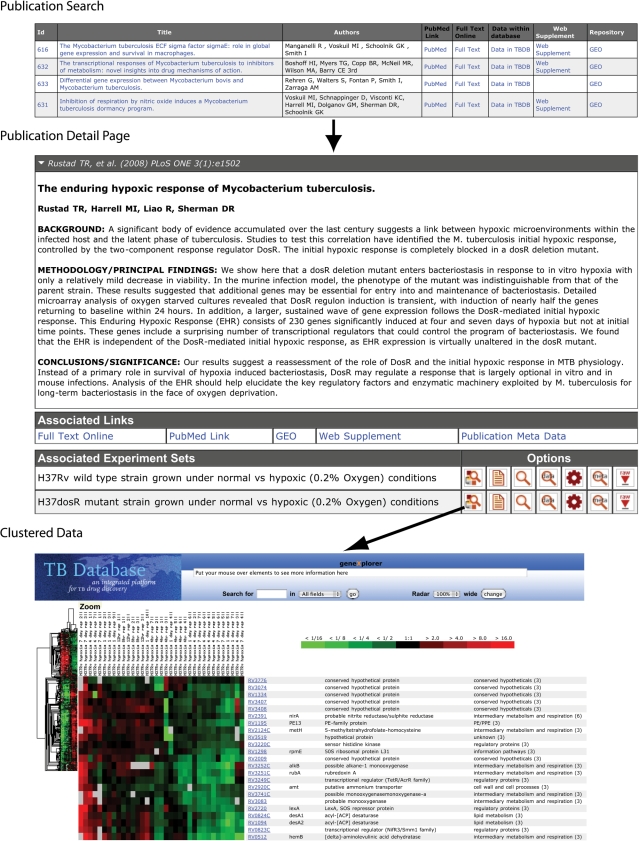
Using Expression Connection, researchers can visualize and explore clustered microarray datasets from publications whose data are present within TBDB. Clustering organizes expression data for genes or reporter sequences into groups that have similar expression profiles. This enables a user to directly view and explore already clustered data within TBDB without needing to go through the data analysis pipeline. As shown in Figure 4, a publication detail page can be accessed by following TB Expression → Gene Expression Publications → ‘Data in TBDB’. Interactive clustered data images for a publication can be navigated using GeneXplorer (20), which provides views of the most correlated genes for a gene of interest or searches for genes using text queries (Figure 4). Thus, this option enables a user to explore and interrogate TBDB for expression data from publications.
Figure 4.
Publication microarray data and expression connection. Researchers can access the full raw microarray data associated with a publication, either for download, or retrieval through the data retrieval and analysis pipeline. In addition, users can explore clustered microarrays data, whereby they can search for particular genes, or identify which genes show coexpression across a particular dataset.
Data analysis
TBDB provides a suite of microarray data analysis tools for its users. All tools are freely available to analyze both public and prepublication data in TBDB. A typical data analysis process at TBDB involves several steps in the following order: Experiment Selection → Gene Selection and Annotation → Data Filtering Options → Data Retrieval → Gene Filtering → Clustering and Image Generation. At each step, a user is presented with various options that allow them to filter and cluster the data according to their needs. For example, a user can employ either the Basic or Advanced Expression Search to choose a set of microarray data for further analysis. Clicking on the ‘Data Retrieval and Analysis’ option invokes the data analysis pipeline, where a user can select various microarray data filtering and transformation options. Many microarray data analysis tools can be applied to datasets, including hierarchical clustering, imputation of missing values, Gene Set Enrichment Analysis (21), Singular Value Decomposition (22) and pathway analyses. All SMD analysis tools [many described previously (9)] have been made available through TBDB. At each step in the data analysis, pipeline a link to a relevant ‘Help’ page is provided, which explains in detail the various available options. In addition, the TBDB data repository provides access to the suite of gene-expression analysis tools provided through the Gene Pattern software (23).
Literature curation
Curating microarray expression data from publications is an important part of TBDB's efforts. We actively search PubMed for relevant publications containing microarray experiments, then obtain the raw data from researchers and load them into TBDB, with detailed experimental annotations.
FUTURE DIRECTIONS
We are working to increase the quality and quantity of data within TBDB and to incorporate additional data types. One of our priorities is to acquire host expression data from M. tuberculosis-infected tissues (mouse, primate and human), and we also plan to expand TBDB's capacity to house and analyze RT–PCR data and will develop tools for comparative analysis of RT–PCR and microarray expression data. We will also implement tools such as GO::TermFinder (24), which allows users to determine whether there are biological themes associated with a list of genes of interest, and tools for the analysis of replicate microarray experiments. We are also working to improve the depth and quality of our genome annotations. We are currently curating TB literature and associating these data with genes and other genomics features. Moreover, we have implemented and will deploy a community annotation infrastructure to allow TB researchers to submit additions and improvements to existing annotations through the TBDB website. We are also using the comparative sequence integrated into TBDB to improve on the accuracy of structural gene annotations and to predict additional potential noncoding genes. Finally, as new TB sequences are produced by the Broad Microbial Sequencing Center, they will be deposited and made publicly available in TBDB. Ultimately, we hope that TBDB will serve as a community hub for TB research; a TB research community information page will be implemented with a listing of TB research labs and colleagues; this will also provide a forum for the community of users including feedback and suggestions from the community that will help us better serve them.
CONCLUSION
TBDB contains annotated genome and expression (microarray and RT–PCR) data and a suite of data analysis tools designed to serve as a unique resource for TB research and for the discovery of new drugs, vaccines and biomarkers. Data within the TBDB and all analysis tools are freely available to researchers. Only prepublication gene-expression data require a password.
FUNDING
The Bill and Melinda Gates Foundation. Funding for open access charge: The Bill and Melinda Gates Foundation.
Conflict of interest statement. None declared.
ACKNOWLEDGEMENTS
We are grateful to the research community for their valuable input and suggestions in building and maintaining this database.
REFERENCES
- 1.Arentz M, Hawn TR. Tuberculosis infection: insight from immunogenomics. Drug Discov. Today. 2007;4:231–236. doi: 10.1016/j.ddmec.2007.11.003. [DOI] [PMC free article] [PubMed] [Google Scholar]
- 2.Corbett EL, Watt CJ, Walker N, Maher D, Williams BG, Raviglione MC, Dye C. The growing burden of tuberculosis: global trends and interactions with the HIV epidemic. Arch. Intern. Med. 2003;163:1009–1021. doi: 10.1001/archinte.163.9.1009. [DOI] [PubMed] [Google Scholar]
- 3.Young DB, Perkins MD, Duncan K, Barry C.E., III. Confronting the scientific obstacles to global control of tuberculosis. J. Clin. Invest. 2008;118:1255–1265. doi: 10.1172/JCI34614. [DOI] [PMC free article] [PubMed] [Google Scholar]
- 4.Flynn JL, Chan J. Tuberculosis: latency and reactivation. Infect Immun. 2001;69:4195–4201. doi: 10.1128/IAI.69.7.4195-4201.2001. [DOI] [PMC free article] [PubMed] [Google Scholar]
- 5.Gandhi NR, Moll A, Sturm AW, Pawinski R, Govender T, Lalloo U, Zeller K, Andrews J, Friedland G. Extensively drug-resistant tuberculosis as a cause of death in patients co-infected with tuberculosis and HIV in a rural area of South Africa. Lancet. 2006;368:1575–1580. doi: 10.1016/S0140-6736(06)69573-1. [DOI] [PubMed] [Google Scholar]
- 6.Cole ST, Brosch R, Parkhill J, Garnier T, Churcher C, Harris D, Gordon SV, Eiglmeier K, Gas S, Barry C.E., III, et al. Deciphering the biology of Mycobacterium tuberculosis from the complete genome sequence. Nature. 1998;393:537–544. doi: 10.1038/31159. [DOI] [PubMed] [Google Scholar]
- 7.Catanho M, Mascarenhas D, Degrave W, Miranda AB. GenoMycDB: a database for comparative analysis of mycobacterial genes and genomes. Genet. Mol. Res. 2006;5:115–126. [PubMed] [Google Scholar]
- 8.Vishnoi A, Srivastava A, Roy R, Bhattacharya A. MGDD: Mycobacterium tuberculosis genome divergence database. BMC Genomics. 2008;9:373–376. doi: 10.1186/1471-2164-9-373. [DOI] [PMC free article] [PubMed] [Google Scholar]
- 9.Demeter J, Beauheim C, Gollub J, Hernandez-Boussard T, Jin H, Maier D, Matese JC, Nitzberg M, Wymore F, Zachariah ZK, et al. The Stanford Microarray Database: implementation of new analysis tools and open source release of software. Nucleic Acids Res. 2007;35:D766–D770. doi: 10.1093/nar/gkl1019. [DOI] [PMC free article] [PubMed] [Google Scholar]
- 10.Galagan JE, Calvo SE, Borkovich KA, Selker EU, Read ND, Jaffe D, FitzHugh W, Ma LJ, Smirnov S, Purcell S, et al. The genome sequence of the filamentous fungus Neurospora crassa. Nature. 2003;422:859–868. doi: 10.1038/nature01554. [DOI] [PubMed] [Google Scholar]
- 11.Galagan JE, Nusbaum C, Roy A, Endrizzi MG, Macdonald P, FitzHugh W, Calvo S, Engels R, Smirnov S, Atnoor D, et al. The genome of M. acetivorans reveals extensive metabolic and physiological diversity. Genome Res. 2002;12:532–542. doi: 10.1101/gr.223902. [DOI] [PMC free article] [PubMed] [Google Scholar]
- 12.Altschul SF, Gish W, Miller W, Myers EW, Lipman DJ. Basic local alignment search tool. J. Mol. Biol. 1990;215:403–410. doi: 10.1016/S0022-2836(05)80360-2. [DOI] [PubMed] [Google Scholar]
- 13.Lowe TM, Eddy SR. tRNAscan-SE: a program for improved detection of transfer RNA genes in genomic sequence. Nucleic Acids Res. 1997;25:955–964. doi: 10.1093/nar/25.5.955. [DOI] [PMC free article] [PubMed] [Google Scholar]
- 14.Finn RD, Mistry J, Schuster-Bockler B, Griffiths-Jones S, Hollich V, Lassmann T, Moxon S, Marshall M, Khanna A, Durbin R, et al. Pfam: clans, web tools and services. Nucleic Acids Res. 2006;34:D247–D251. doi: 10.1093/nar/gkj149. [DOI] [PMC free article] [PubMed] [Google Scholar]
- 15.Griffiths-Jones S, Moxon S, Marshall M, Khanna A, Eddy SR, Bateman A. Rfam: annotating non-coding RNAs in complete genomes. Nucleic Acids Res. 2005;33:D121–D124. doi: 10.1093/nar/gki081. [DOI] [PMC free article] [PubMed] [Google Scholar]
- 16.Squires B, Macken C, Garcia-Sastre A, Godbole S, Noronha J, Hunt V, Chang R, Larsen CN, Klem E, Biersack K, et al. BioHealthBase: informatics support in the elucidation of influenza virus host pathogen interactions and virulence. Nucleic Acids Res. 2008;36:D497–D503. doi: 10.1093/nar/gkm905. [DOI] [PMC free article] [PubMed] [Google Scholar]
- 17.Cole ST. Learning from the genome sequence of Mycobacterium tuberculosis H37Rv. FEBS Lett. 1999;452:7–10. doi: 10.1016/s0014-5793(99)00536-0. [DOI] [PubMed] [Google Scholar]
- 18.Terwilliger TC, Park MS, Waldo GS, Berendzen J, Hung LW, Kim CY, Smith CV, Sacchettini JC, Bellinzoni M, Bossi R, et al. The TB structural genomics consortium: a resource for Mycobacterium tuberculosis biology. Tuberculosis. 2003;83:223–249. doi: 10.1016/s1472-9792(03)00051-9. [DOI] [PubMed] [Google Scholar]
- 19.Sherman DR, Voskuil M, Schnappinger D, Liao R, Harrell MI, Schoolnik GK. Regulation of the Mycobacterium tuberculosis hypoxic response gene encoding alpha-crystallin. Proc. Natl Acad. Sci. USA. 2001;98:7534–7539. doi: 10.1073/pnas.121172498. [DOI] [PMC free article] [PubMed] [Google Scholar]
- 20.Rees CA, Demeter J, Matese JC, Botstein D, Sherlock G. GeneXplorer: an interactive web application for microarray data visualization and analysis. BMC Bioinformatics. 2004;5:141. doi: 10.1186/1471-2105-5-141. [DOI] [PMC free article] [PubMed] [Google Scholar]
- 21.Reich M, Liefeld T, Gould J, Lerner J, Tamayo P, Mesirov JP. GenePattern 2.0. Nat. Genet. 2006;38:500–501. doi: 10.1038/ng0506-500. [DOI] [PubMed] [Google Scholar]
- 22.Subramanian A, Tamayo P, Mootha VK, Mukherjee S, Ebert BL, Gillette MA, Paulovich A, Pomeroy SL, Golub TR, Lander ES, Mesirov JP. Gene set enrichment analysis: a knowledge-based approach for interpreting genome-wide expression profiles. Proc. Natl Acad. Sci. USA. 2005;102:15545–15550. doi: 10.1073/pnas.0506580102. [DOI] [PMC free article] [PubMed] [Google Scholar]
- 23.Alter O, Brown PO, Botstein D. Singular value decomposition for genome-wide expression data processing and modeling. Proc. Natl Acad. Sci. USA. 2000;97:10101–10106. doi: 10.1073/pnas.97.18.10101. [DOI] [PMC free article] [PubMed] [Google Scholar]
- 24.Boyle EI, Weng S, Gollub J, Jin H, Botstein D, Cherry JM, Sherlock G. GO::TermFinder—open source software for accessing Gene Ontology information and finding significantly enriched Gene Ontology terms associated with a list of genes. Bioinformatics. 2004;20:3710–3715. doi: 10.1093/bioinformatics/bth456. [DOI] [PMC free article] [PubMed] [Google Scholar]


