Figure 1.
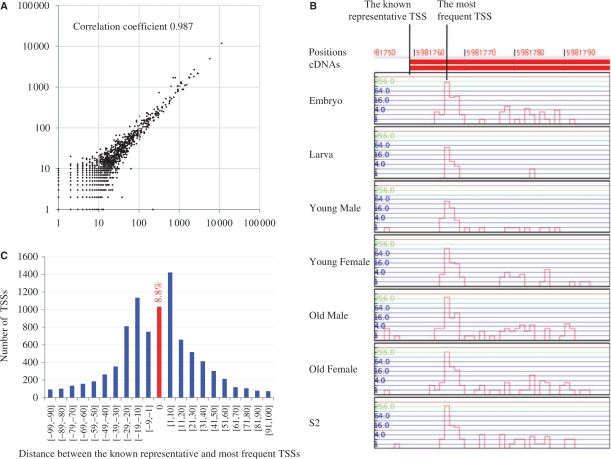
Statistical analysis of the TSS information. (A) A dot represents one non-redundant 5′-end tag, such that the values on the x-axis and y-axis indicate the frequencies of the focal tags in the respective experiments. (B) A case in which the known representative TSS is not consistent with the most frequent TSS. Note that the most abundant TSSs coincide across the seven different libraries. (C) The distribution of distances between the known representative TSSs and most frequent TSSs. Overall, 1033 (8.8%) of the 11 725 known representative TSSs coincide with the most frequent TSSs.

