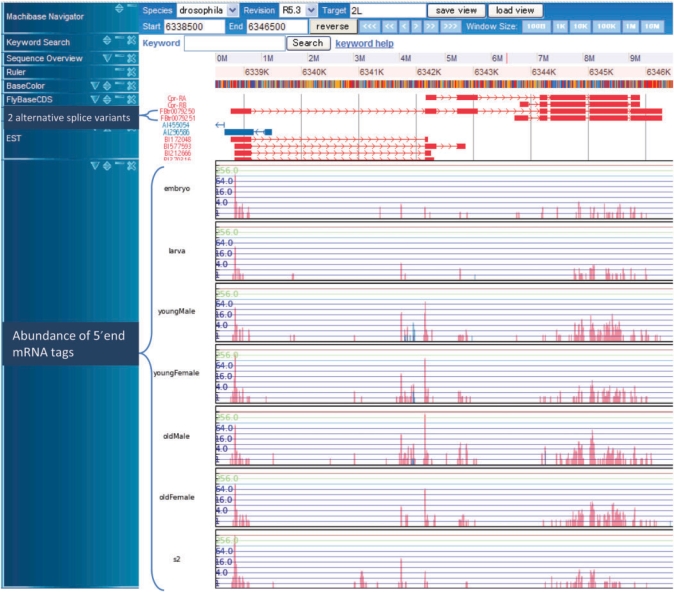
Figure 2.
Snapshot of the MachiBase genome browser. The frequencies of the 5′-end mRNA tags mapped to individual positions on the fruitfly genome in the seven libraries are displayed as histograms in the bottom seven tracks. In the histograms, the vertical bars in log scale indicate the numbers of 5′-end mRNA tags aligned to each position on the x-axis. The upper track shows the exon–intron structures of two alternative splice variants. Observe that the peaks for the 5′-end tags are around the 5′-end of the longer splice variant in all of the seven libraries. In addition, note that many 5′-end tags are expressed from the second, second-to-last, and last exons in four adult samples (young/old and male/female).

