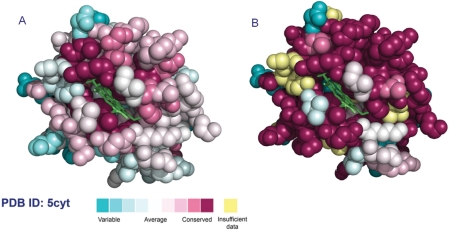
Figure 1.
Cytochrome c. (A) The conservation coloring profile from the ConSurf-DB repository, mapped onto a space-filling representation of the protein. The conservation coloring scale is shown below. The HEME group, in stick representation, is colored green. (B) The same view as calculated by the ConSurf server using default parameters.

