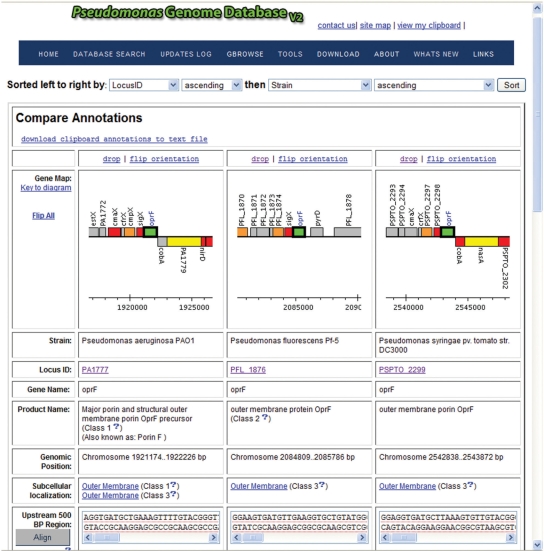
Figure 1.
Screenshot of result from a simple ‘Compare’ analysis of selected Pseudomonas oprF genes in different species. Note how this interface, along with the complementary Ortholog View, includes a navigatable, visual representation of the genomic context for the genes being compared that is automatically oriented to aid comparison. Users can scroll down further on the page to compare other features of these genes, including their protein and nucleic acid sequences, upstream sequences that may contain promoter regions, and other annotation information.

