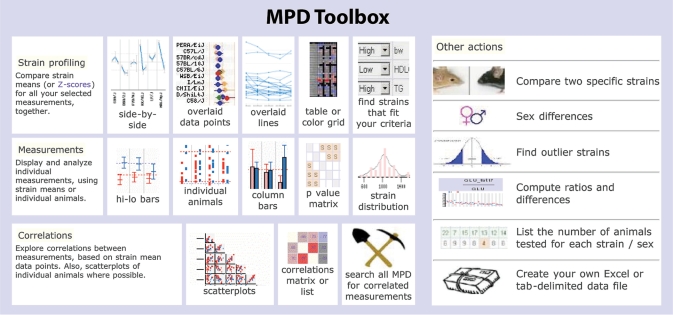
Figure 1.
MPD Toolbox. Screenshot of MPD analysis tools, grouped by function: strain profiling (identifying mouse models with specific characteristics), measurement displays, correlations, and other actions. Some of our new tools are featured elsewhere: side-by-side plot and color-grid are shown in Figure 5, the overlaid-data-points plot in Figures 4 and 6. Try the interactive Tool Demo from the MPD homepage or go to http://phenome.jax.org/phenome/trytools.

