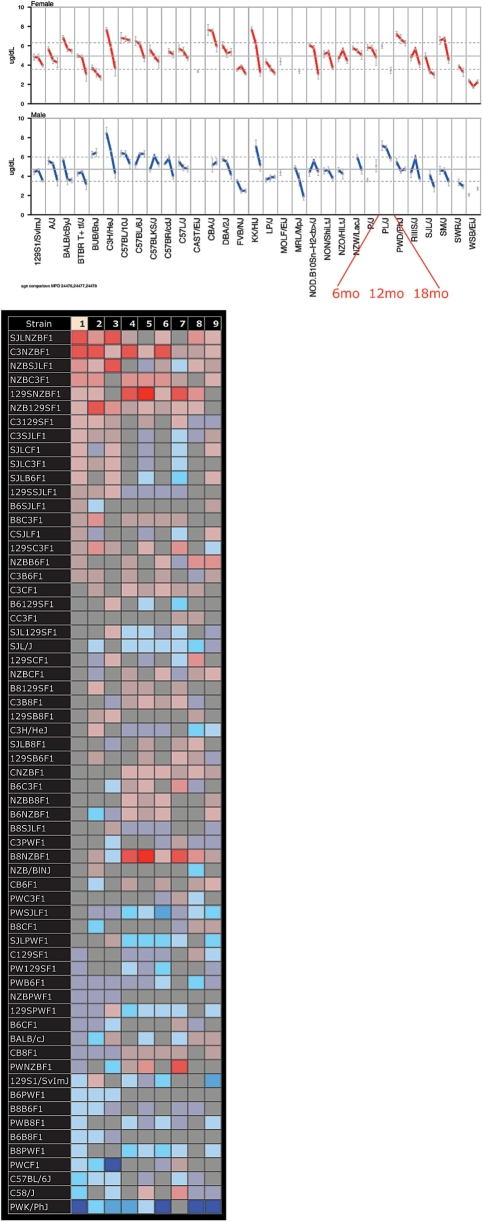
Figure 5.
New phenotype tools for strain profiling and identifying important new mouse models for research. The Jackson Aging Center is in the process of testing 32 inbred strains for a wide variety of phenotypic traits at 6, 12, 18 and 24 months of age. A new tool has been developed to visualize aging trends graphically (above). In this example, three time points for thyroxine (T4) are shown for each strain. Such a tool is critical for understanding aging processes which are not always linear over time. This tool helped identify several complex phenotypes which would not have been discovered if examining only one time point. Another new tool useful for identifying mouse models in shown in the lower panel. The color grid tool is based on the heat map concept using Z-scores. Strain names are listed on the left, measurement numbers are shown along the top (1–6) which are fully defined below the grid when viewing online. Shades of red indicate those measurements that are above the overall mean and blue indicates those that are below. Intensity of color tracks with severity, where the more intense colors are the most extreme. More new tools are featured in Figure 6. Data (upper) from Yuan3 MPD:244 (2008); (lower) Churchill1 MPD:171 (2004).

