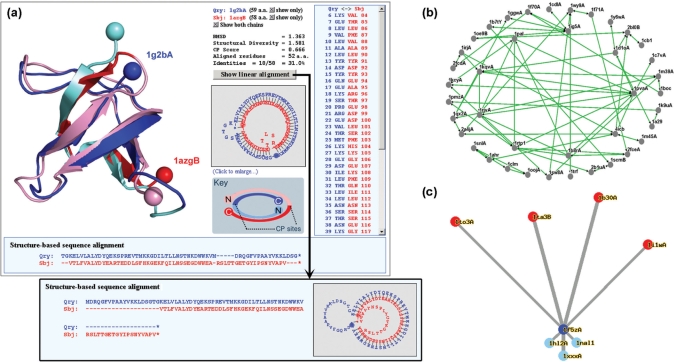
Figure 1.
Various methods provided by CPDB for visualizing CP relationships among proteins. (a) Circularly permutated structure and sequence alignments. Cα atoms of terminal residues of the superimposed structures are shown as balls so that the different locations of termini, which are a property of CP, can be easily recognized. Two proteins are colored very differently. The boundaries between the lighter and darker colors are the positions of CP site. (b) Network view of a CP cluster. A CP cluster usually contains several CP pairs with direct or indirect linkages. Proteins with more complicated CP relationships are placed closer to the center of this network. (c) Star-like map of structural homologs. Query protein is at the center (the blue circle) with its circular permutants (red circles) radiating upwards and linear structural homologs (light blue circles) radiating downwards. Connecting lines are drawn in a way that their lengths are in proportion to the structural diversities (41) between proteins.

