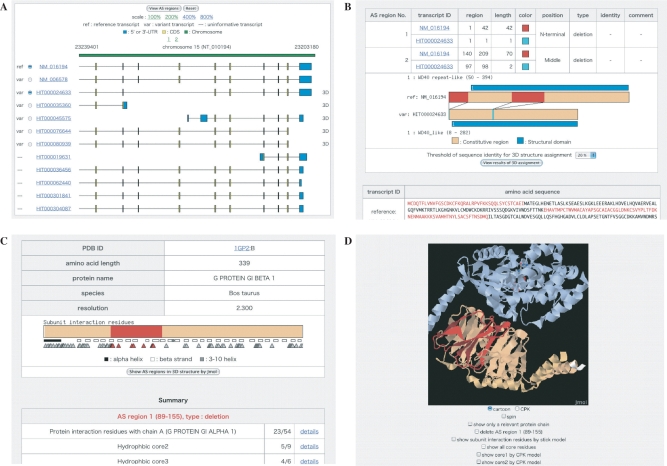
Figure 1.
Data display screens. (A) A cluster of AS variant sequences (CDS in yellow and UTR in blue) aligned with a chromosome sequence (green). A ‘3D’ mark in the rightmost column indicates that AS regions derived from the variant sequence in that row have 3D structure-related annotations. (B) Features of AS regions and their positional relationships to structural domains (blue). AS regions are colored by the type of change (deletion: red, insertion: cyan and substitution: violet). (C) Positional relationships of AS regions to hydrophobic cores and interaction sites detected in a relevant PDB entry. AS regions are shown in the same colors as in (B). Interaction sites are denoted with triangles. The positions of secondary structures are depicted with small open or filled boxes. (D) Spatial locations of AS regions in the 3D structure. A relevant protein chain with AS regions is shown in the same colors as in (C). Other interacting molecules are also shown in different colors.

