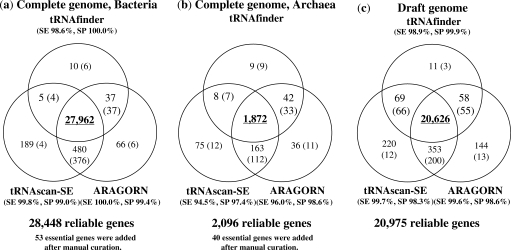
Figure 2.
Result of tRNA gene search. Numbers in Venn diagrams show numbers of tRNA genes found by individual programs and those in parenthesis show numbers after manual checks by experts. Abbreviations and definitions are the followings: SE, sensitivity level = 100 × (the number of reliable tRNAs predicted by one program)/(the number of all reliable tRNAs); SP, specificity level = 100 × (the number of reliable tRNAs predicted by one program)/(the number of candidate tRNAs predicted by the respective program). Because tRNAfinder can not predict tRNAs with intron, SE and SP are not presented for archaea.

