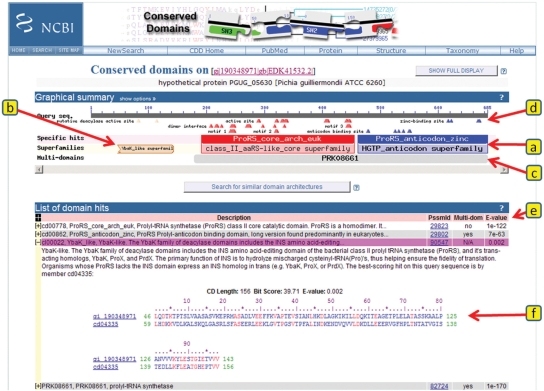
Figure 1.
CDD-based annotation on a recently predicted protein sequence. This summary is the default concise version of the annotation view as generated by CD-Search, using precalculated alignment information. The view is divided into two panels, a graphical summary (items a through d) and a table detailing the matches (items e and f). The query sequence is represented as a gray bar in the top portion of the graphical summary, with a ruler indicating sequence length and coordinates. (a) ‘Specific hits’ to NCBI-curated domain models are indicated in a separate area below the query sequence, and the corresponding balloons are rendered in bright colors. The extent of the hits also defines annotations with conserved domain ‘Superfamilies’, which are indicated in the area below the ‘Specific hits’, and enclosed in boxes to indicate superfamily relationships. If the full display is selected, an area summarizing ‘Non-specific hits’ will be shown as well, and the boxes will be drawn to resolve superfamily relationships, where highest ranked match for each superfamily defines the extents of each corresponding box. ‘Non-specific hits’ and ‘Superfamilies’ balloons are rendered in pastel colors, with each homologous superfamily being assigned a separate color. (b) If a region of the query has no ‘Specific hits’, only the ‘Superfamilies’ annotation is shown in the concise default display. If a match to a conserved domain model is incomplete, as in this case, the balloon is rendered with a jagged edge to indicate a missing region. (c) In the default concise display, matches to multi-domain models are rendered as gray balloons in a separate area of the summary graph. Only the best-ranked nonoverlapping multi-domain models are shown. (d) Functional sites as annotated on NCBI-curated domain models are mapped to the query sequence. Sites are mapped from the highest ranked model only, and they are colored to correspond to their source model. When no ‘Specific hits’ are available, such as in (b), sites may still be mapped if they have been annotated on the parent model of a hierarchy that gave a ‘Non-specific hit’. Both conserved domain balloons and site annotations are hot-linked so that moving the mouse over the objects displays pop-ups with additional information, and so that clicking on the objects generates summary pages for the particular domain model, embedding the user query sequence in the alignment for further analysis, if applicable. (e) A table view summarizes what the graphical view indicates as well, listing E-values, multi-domain status and various identifiers for the conserved domain models identified as matches. The table rows can be expanded (f) to display detailed sequence alignment information between the query and the domain model's consensus sequence. An alignment of all sequences comprising a domain model, with or without the query sequence embedded, is accessible by clicking on the domain's balloon representation in the graphical summary or its unique numerical identifier (PSSM-Id) in the tabular summary, respectively.

