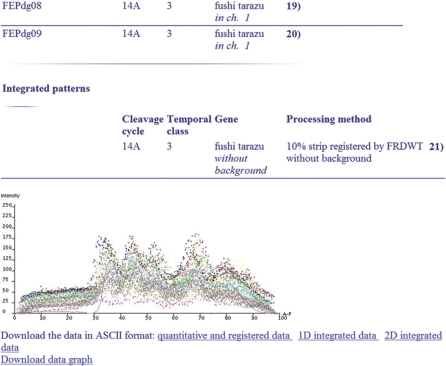
Figure 2.
One-dimensional quantitative data on expression of ftz in temporal class 3 extracted from 20 individual embryos are plotted as dots. The reference data are shown with solid line. The one-dimensional quantitative data are extracted from the central 10% strip along the midline of an embryo in the A–P direction.

