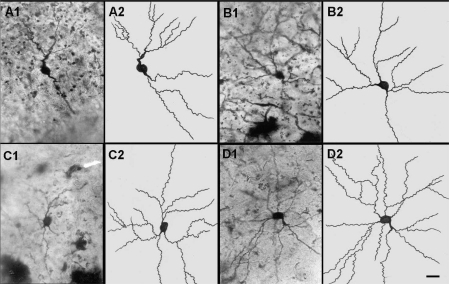
Figure 2.
Representative photomicrographs (A1, B1, C1, D1) and camera lucida tracings (A2, B2, C2, D2) of amygdaloid neurons from control (A1, A2) and 2 ml/kg CeA (B1, B2); 4 ml/kg CeA (C1, C2) and 6 ml/kg CeA (D1, D2) treated for 4 weeks. Note the significant increase in dendritic length and branches in rats treated with 4 and 6 ml/kg CeA for 4 weeks. Scale bar = 20 µ.

