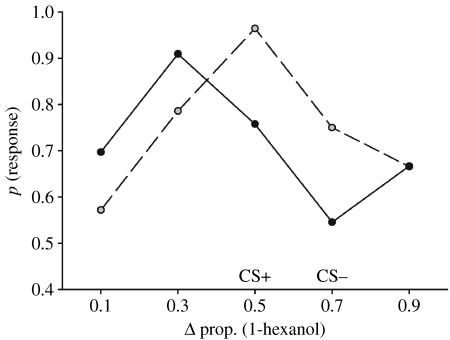
Figure 1.
A comparison of the olfactory response function generated by associating two closely related odours with different outcomes (solid line, CS+/CS−, CS+=1.0 M sucrose and CS−=1.0 M salt, N=33). The response function formed simply by associating one odour with 1.0 M sucrose (dashed line, CS+, N=28) reveals that differential learning produces a bias towards novel olfactory stimuli (lreg, two-way interaction Χ22=7.03, p=0.030). For each response function, the ‘peak’ was significantly different from all other points along the gradient (comparisons performed within a gradient to the peak point only, one-tailed LSMC: p<0.05). The x-axis refers to the composition of the binary odour presented during the test; ph refers to the proportion of 1-hexanol (ph) present in the binary odour. The CS+ was always ph=0.5 and the CS− was always ph=0.7. The y-axis represents the probability of observing a conditioned response (proboscis extension) by honeybees towards a test odour.

