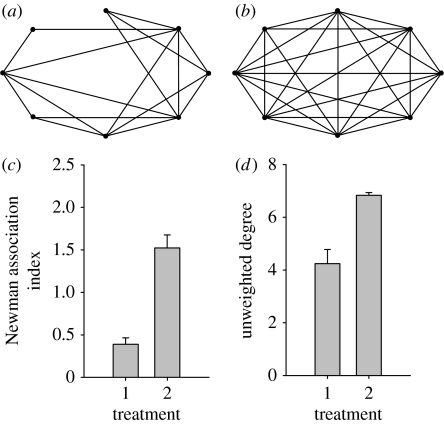
Figure 1.
Example of LFSNs observed (a) in the mixed-sex treatment and (b) in the same-sex treatment. (c–d) Summary of network measures on female–female associations illustrating (c) the average Newman index and (d) the average unweighted degree for LFSNs in the two treatments. Error bars represent standard error. 1, mixed sex; 2, same sex.

