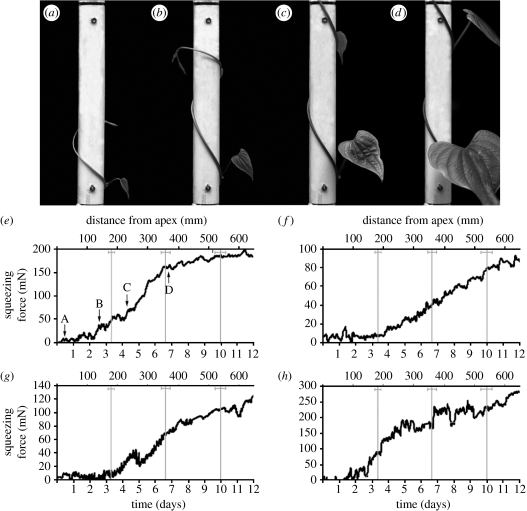
Figure 3.
Development of twining shoot and increase in squeezing force for four stems. (a–d) Stem twining around the force plate (half-pole held in place by two load cells). (e–h) Development of the squeezing force (running average of 12 values, or 2 hours interval) as a function of time and arc length from the shoot apex to the lower edge of the sensing region. Force was proportional to the total output of two load cells holding the force plate. (e) An arrow indicates the position corresponding to the time of each picture (a–d) for the first plant. The positions where gyres are completed are shown by grey vertical lines (±1 standard deviation; standard deviation increases because error accumulates with gyre number).

