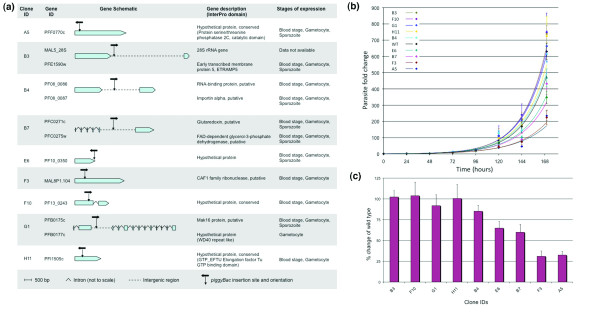
Figure 5.
A phenotype screen for attenuated blood-stage growth. (a) A schematic of mutant P. falciparum clones selected for growth rate analysis. Black vertical and horizontal arrows indicate the insertion site and orientation of the piggyBac transposon, respectively. The gene schematic, description and expression stages were all obtained from the PlasmoDB database at http://www.plasmodb.org. (b) Growth curves of 9 insertional mutant clones, were obtained by plotting parasite fold change against time. For the wild type (WT), an average of fold changes from three different NF54 clones was used. The order of samples, from top to bottom, indicates a decrease in parasite fold changes. (c) A bar-graph of fold changes in parasite numbers after 7 days of growth revealed a spectrum of attenuated growth phenotypes in several mutant clones when compared to the wild type clones. The error bars in (b) and (c) represent standard deviation from the mean of 3 measurements.

