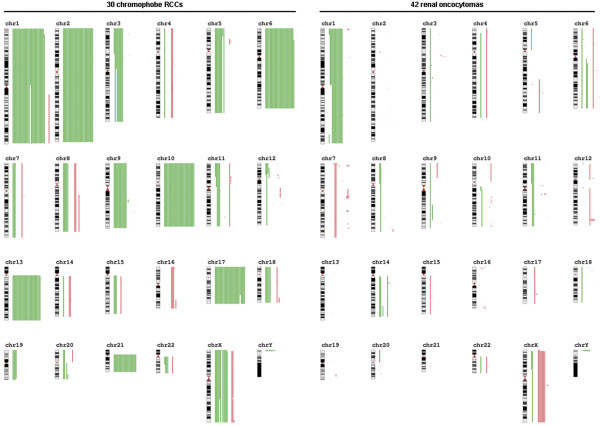
Figure 2.
Summary of genomic imbalances in 30 chRCCs and 42 ROs obtained with 250 K SNP array analysis. Green lines on the right of ideograms indicate losses, whereas red lines represent gains. Notice the smaller overlapping deletions at chromosome 11p and 12p in two and three cases of chRCC, respectively. Notice the loss of chromosome 1 and gain of the X chromosome in RO. Loss at the PAR1 region indicates the loss of the Y chromosome.

