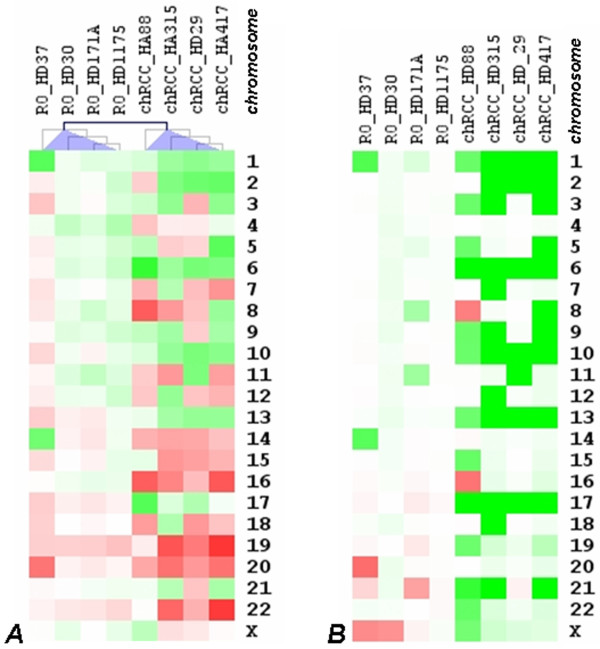
Figure 5.
Hierarchical clustering of gene expression profiles and comparative genomic microarray analysis of RO and chRCC. (A) Genomic regions showing a significant number of up- and down-regulated genes are red and green, respectively. (B) Copy number changes of chromophobe RCCs and ROs are marked by green (loss) and red (gain). Generally, loss of chromosomes 1, 2, 6, 10, 13, 17 and 21 is associated with the downregulation of genes. However, genes at chromosomes 16, 19, 20 and 22 found to be overexpressed in spite of the normal diploid copy number of these chromosomes.

