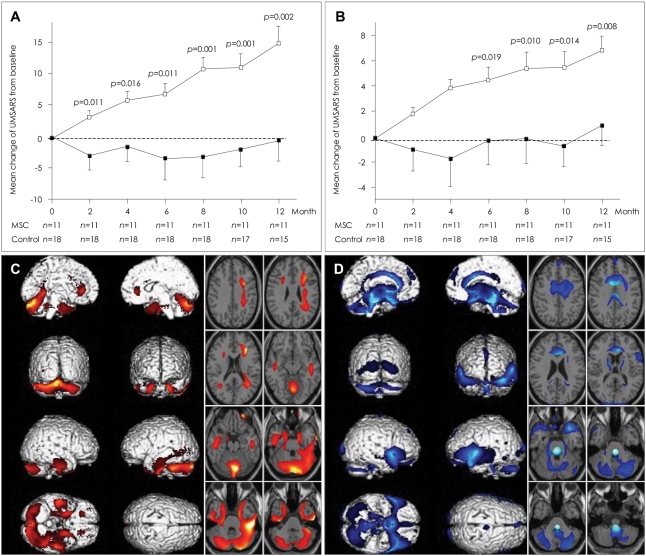
Fig. 3.
Changes from baseline scores (mean and SE values) on the Unified Multiple System Atrophy Rating Scale (UMSARS) for MSC-treated and control patients throughout the 12 months of follow-up (A). UMSARS I analysis between MSC-treated and control patients (B: black squares=MSC-treated patients; gray triangles=control patients). The improvement on the UMSARS was significantly greater in the MSC group than in the control group at all visits throughout the 12-month study period. Cerebral glucose metabolism in the MSC-treated patients was higher in the follow-up scan than in the initial scan in the cerebellum and white matter (C, red color), whereas in the control group it was significantly lower in the follow-up scan than in the initial scan in the cerebellum and brainstem (D, blue color). MSC: mesenchymal stem cell.

