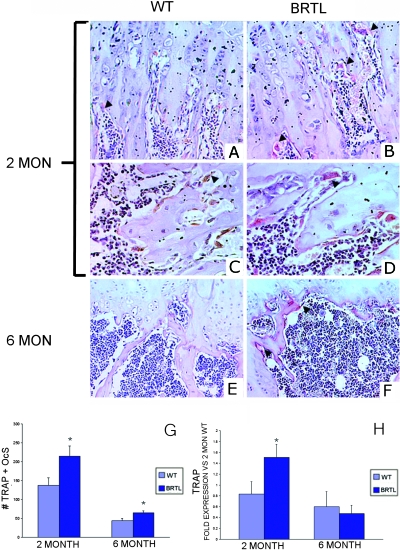
FIG. 4.
Immunohistochemical measurement of TRACP+ osteoclasts in Brtl and WT femurs. (A–F) Representative images of 2- and 6-mo WT and Brtl decalcified paraffin femoral sections, in the region below the growth plate, stained for TRACP enzymatic activity and counterstained with hematoxylin. (A, C, and E) Regions from WT mice at 2 (A and C) or 6 mo (E). (B, D, and F) Regions from Brtl mice at 2 (B and D) or 6 mo (F). Arrowheads highlight a few of the TRACP+ osteoclasts stained red, all of which are located on resorptive bone surfaces. (C and D) Higher magnification views to show that Brtl osteoclasts (D) are generally larger and more intensely TRACP stained than are WT osteoclasts (C). (A, B, E, and F) Original magnification, ×300. (C and D) Original magnification, ×500. (G) Quantitation of the number of TRACP+ osteoclasts in Brtl femora at 2 (left) and 6 (right) mo. (H) TRACP expression in total RNA of whole femora in Brtl and WT; expression is normalized to the 2-mo WT pool.

