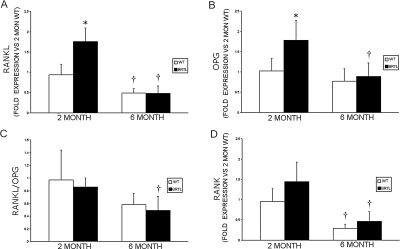
FIG. 5.
Real-time RT-PCR determination of RANKL, OPG, and RANK transcripts in Brtl and WT femurs. (A) Expression of RANKL compared with 2-mo WT mice. (B) Expression of OPG vs. 2-mo WT mice. (C) RANKL/OPG ratio for each genotype and age group is the average of the RANKL/OPG ratios determined for each mouse, using RANKL and OPG transcripts normalized to GAPDH. (D) Expression of RANK compared with 2-mo WT mice. *p < 0.05, difference between WT and Brtl, † p < 0.05, difference between 2- and 6-mo mice from the same genotype.

