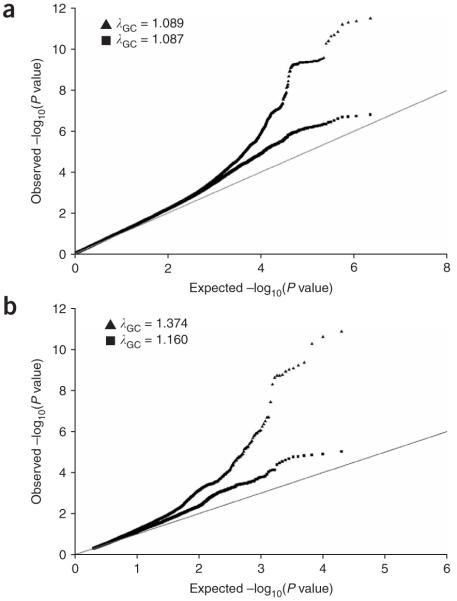
Figure 2.
Quantile-quantile plots supporting the presence of additional loci associated with height. (a) Plot of 2,260,683 SNPs from the meta-analysis of the six GWA scans (n = 15,821). Each black triangle represents an observed statistic (defined as the -log10(P)) versus the corresponding expected statistic. The black squares correspond to the distribution of test statistics after removing markers correlated to the 12 height signals with P < 5 ×10⁻⁷ described in Table 1. The gray line corresponds to the null distribution. (b) Association results from Weedon et al.18 provide independent evidence that the top 10,000 SNPs from our meta-analysis exceed the null expectations (gray line). We selected the top 10,000 SNPs from our meta-analysis before (black triangles) and after (black squares) removing SNPs marking the known height loci (identified by us and in the accompanying manuscript) and retrieved the corresponding P values from Weedon et al. We show one-tailed P values because we corrected for the direction of effects, if needed. Inflation factors are unusually high because the analysis is restricted to the top 10,000 SNPs, which are likely enriched for SNPs that are truly associated with height variation.

