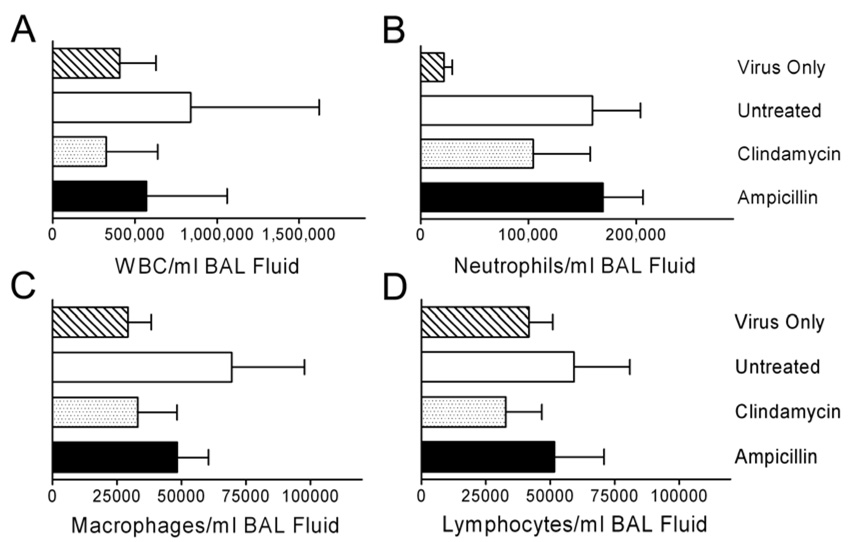
Figure 4.
Cell counts from broncho-alveolar lavage fluid following treatment for secondary bacterial pneumonia. Groups of mice were infected with influenza virus PR8 then challenged 7 days later with S. pneumoniae or mock challenged (n=6) and monitored for development of pneumonia by bioluminescent imaging. Treatment with clindamycin (n=6), ampicillin (n=9), or mock treatment (n=6) was initiated after development of pneumonia. 24 hours after the first antibiotic dose, lungs were lavaged and assayed for cell counts by flow cytometry. Error bars indicate the s.d. of the mean values. The differences are not statistically significant.

