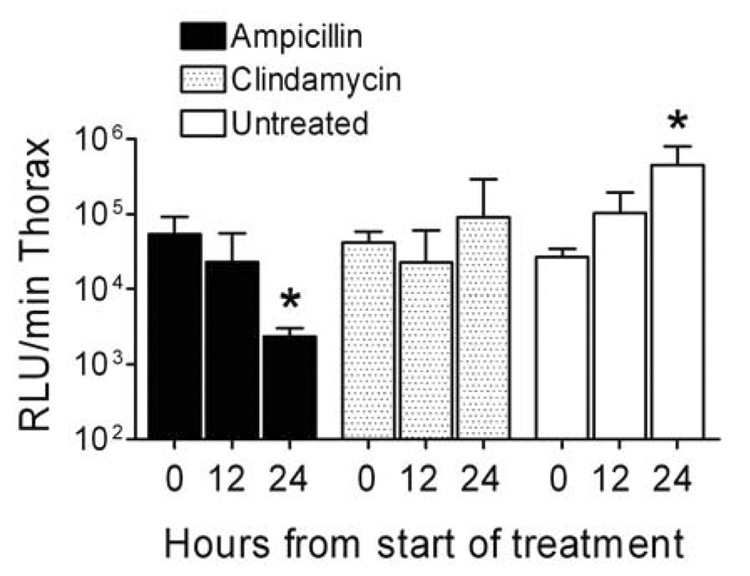
Figure 5.
Bacterial load in the lungs during treatment of secondary bacterial pneumonia. Groups of mice were infected with influenza virus PR8 then challenged 7 days later with S. pneumoniae and monitored for development of pneumonia by bioluminescent imaging. Treatment with clindamycin (n=6), ampicillin (n=9), or mock treatment (n=6) was initiated after development of pneumonia. Bacterial lung load was assessed in live, anesthetized animals 0, 12, and 24 hours from the start of treatment using bioluminescent imaging and is reported as mean ± s.d. of the flux of light from the thorax (relative light units (RLU) per minute). An asterisk (*) indicates a significant difference (p < 0.05) by ANOVA compared to the zero hour timepoint for that group..

