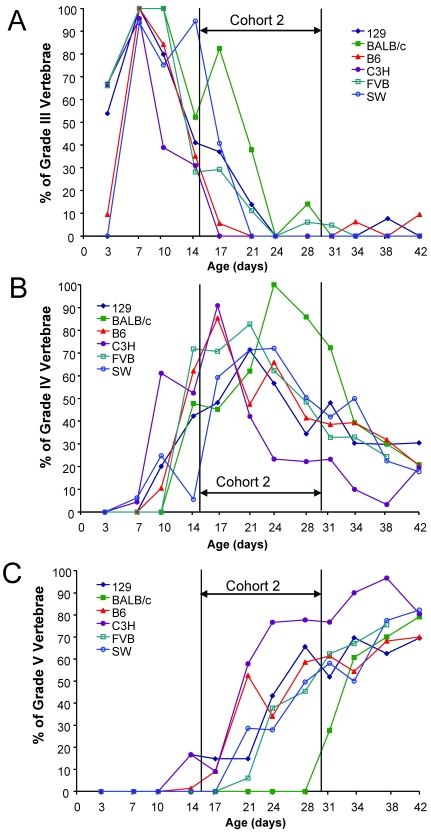
Figure 4.
Histologic differences in postnatal vertebral development of the total tail varied across genetic backgrounds of mice. The percentage of vertebrae (n = 3 mice for each age group for each strain) was graded and quantified from the 35-mm sections of total tail for each strain as a function of age. (A) Grade III vertebrae, classified as immature yet ossified, were predominant in cohort 1 animals; (B) Grade IV vertebrae, classified as immature with secondary centers of calcification, were predominant in Cohort 2 animals; (C) Grade V vertebrae, those that are the most mature with ossified end plates, were predominant in Cohort 3 animals. Genetic differences in tail development for Grades IV and V were notable in Cohort 2 animals between C3H, B6, and BALB/c strains (B, C).

