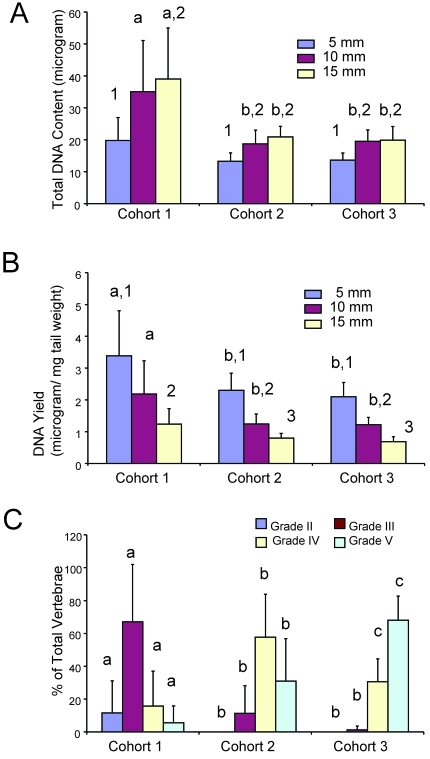
Figure 5.
Total DNA content and DNA yield per tail biopsy differed by age and biopsy length. Each age cohort (n = 24 for each bar representing strain and age collapsed for each length within a cohort ) was graphed relative to tail biopsy length harvested. (A) Total DNA extracted was greatest in the youngest animals and in long biopsy lengths. (B) Relative yield of DNA extracted from biopsies shows a higher efficiency (by tissue weight) of DNA harvest from shorter biopsies and younger mice. Different letters (a, b) on the bar graphs indicate significant (P < 0.05) differences between age cohorts within the same length of biopsy. Different numbers (1 through 3) indicate lengths of biopsy are significant (P < 0.05) within a given age cohort. (C) Similarly vertebral development as a function of age was determined for each cohort. Different letters (a, b, c) on the bar graphs indicate significant (P < 0.05) differences between age cohorts within the same grade. Compared with other cohorts, cohort 1 mice have very low prevalence of grade IV and V vertebrae; therefore, tissues are more cellular and less mineralized in nature.

