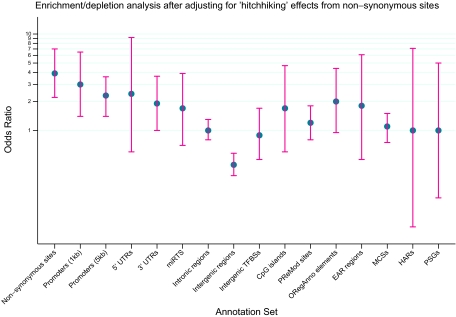
Fig. 2.
Odds ratios for TAS block enrichment/depletion analysis after adjusting for “hitchhiking” effects from nonsynonymous sites. Four annotation sets (Splice sites, Validated enhancers, EvoFold elements, and noncoding RNAs) are not represented here because no TAS blocks mapped to these annotation sets. The blue circle represents the point estimate of the odds ratio (OR) and the red lines represent the 95% CI. Possible “hitchhiking” effects from nonsynonymous sites are reduced by discarding any TASP/control SNP in r2 > 0.6 with a nonsynonymous SNP. For an explanation of the annotation sets on the x axis, we refer the reader to Table S4. Note that the y axis is on the log scale. Nonsynonymous OR computation is not adjusted for “hitchhiking” effects.

