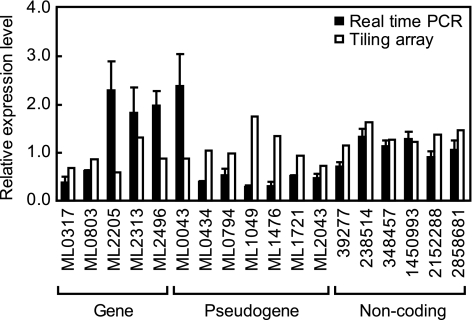
FIG. 4.
Comparison of RNA expression between real-time PCR and tiling array. Relative RNA expression levels detected by tiling array analysis and quantitative real-time PCR were compared. Genes and pseudogenes are indicated by accession numbers. Noncoding regions are indicated by their starting position in the M. leprae genome. Data are from three independent real-time PCRs and are expressed as means ± standard errors.

