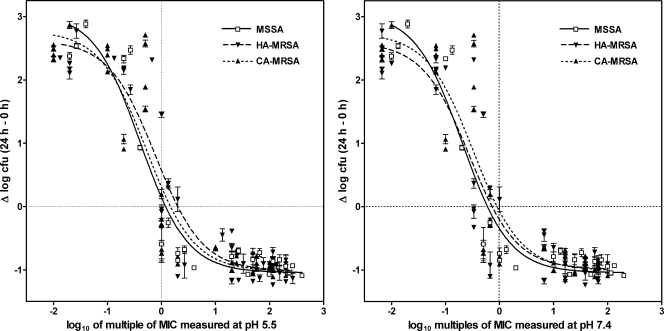
FIG. 1.
Dose-response curves of ceftobiprole against MSSA (strains ATCC 25293, ATCC 11632, and NRS52), HA-MRSA (strains ATCC 33591, ATCC 33592, ATCC 433000, NRS18, NRS126, and VRS1), and CA-MRSA (strains NRS192, N4090440, N4042228, STA44, STA228, and MEH22256-05) phagocytized by human THP-1 macrophages after 24 h of incubation of the cells in the presence of increasing concentrations of the antibiotic. The ordinate shows the change in the number of CFU (means ± standard deviations; n = 3; several standard deviation bars are smaller than the symbols) per mg of cell protein. The abscissa is the multiple of the MIC (in log10 units) obtained for each strain when it was tested in broth at pH 5.5 or pH 7.4 (for strains for which different MICs were obtained [Table 1], calculations were made on the basis of the means of these values). Data from dose-response experiments performed with each strain (see the supplemental material) of each of the three phenotypes indicated above were pooled and used to fit one single sigmoidal function. The equation used, the goodness of fit, the pertinent pharmacological descriptors, and a statistical analysis of their differences (between groups and between mode of plots) are shown in Table 2.

