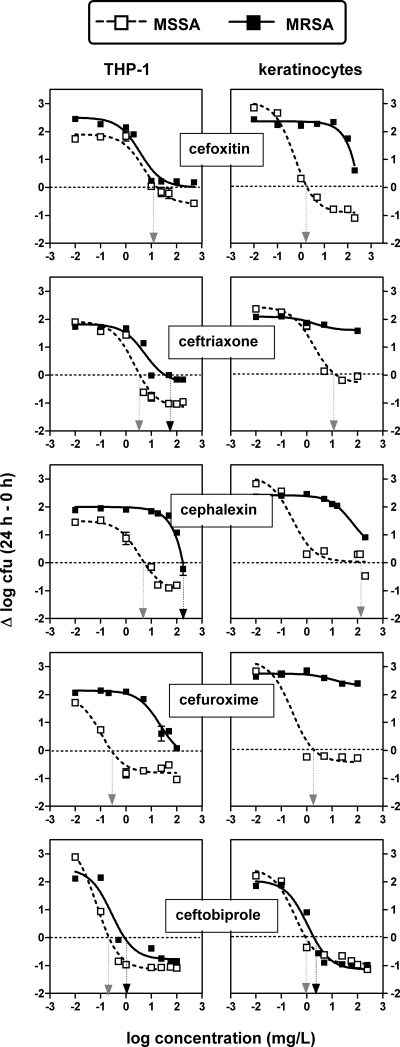
FIG. 3.
Dose-response curves of cephalosporins against MSSA (ATCC 25293) and MRSA (ATCC 33591) phagocytized by human THP-1 macrophages or skin keratinocytes after 24 h of incubation of the cells in the presence of increasing concentrations of the antibiotics. The ordinate shows the change in the number of CFU (means ± standard deviations; n = 3; several standard deviation bars are smaller than the symbols) per mg of cell protein. The vertical arrows point to the Cs for each condition (gray arrow, MSSA; black arrow, MRSA). The goodness of fit, the pertinent pharmacological descriptors, and a statistical analysis of their differences (between antibiotics and between MSSA and MRSA) are shown in Table 4.

