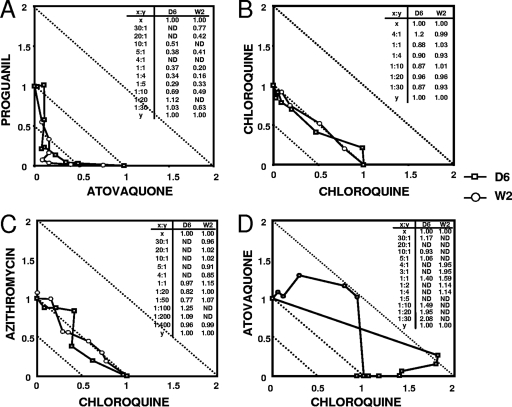
FIG. 1.
Isobologram analysis of IC50s of single and combination drugs at fixed concentrations. ΣFIC50 values at fixed drug concentrations are shown in inset tables. Graphs display the following interactions: synergism (A), indifference (B and C), antagonism (D). ND, not determined. Data are from a representative of three to five experiments.

