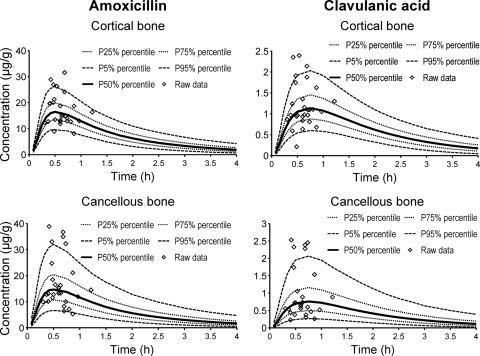
FIG. 4.
Visual predictive check after treatment with 2,000 mg amoxicillin and 200 mg clavulanic acid. The plots show the observed data, the 90% prediction (P) intervals (5th to 95th percentiles), and the interquartile ranges (25th to 75th percentiles). Ideally, 50% of the raw data points should fall inside the interquartile range at each time point and 90% of the raw data should fall inside the 90% prediction interval. Visual predictive checks are based on the results obtained with NONMEM.

