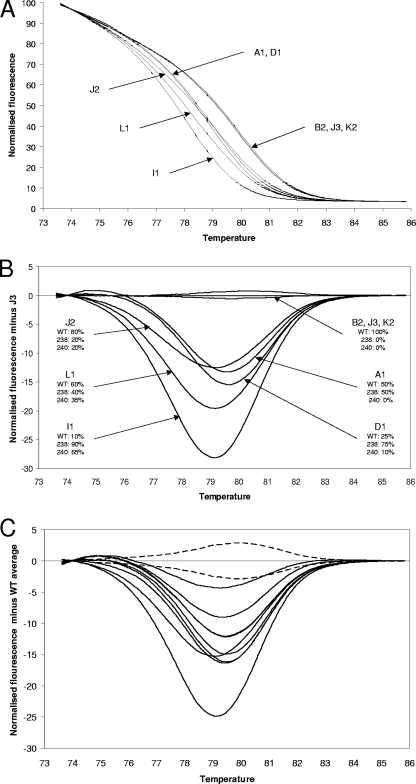
FIG. 1.
HRM data. (A) Normalized HRM graphs from the PAH isolates. Isolates containing mutated alleles (A1, D1, J2, L1, and I1) are clearly separated from isolates containing only WT alleles (B2, J3, and K2). (B) Difference graph from the PAH isolates, with the fluorescence of isolate J3 set as the baseline. For each isolate, the number and allelic distribution are stated. (C) Difference graph of the additional 27 SENTRY isolates (18 WT, 7 single mutant, 2 double mutant) isolates. The baseline used was the average fluorescence data of 21 WT (ESBL negative) isolates. The area representing the 95% confidence limit for the WT sequence is delineated with dotted lines. All ESBL-positive isolates yielded difference graph curves outside the 95% confidence limit area. The two curves with nadirs displaced to the left are the two double-mutant isolates, 14 and 18.

