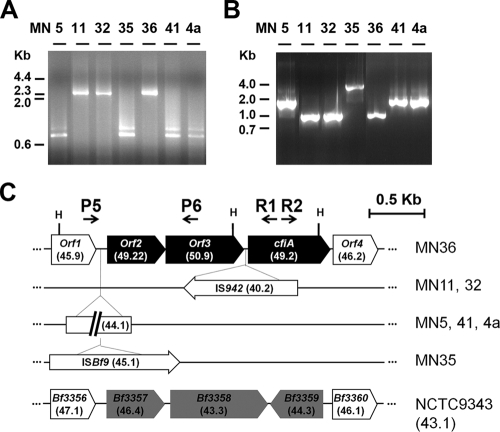
FIG. 2.
Structures of cfiA upstream sequences. (A) iPCR fragments amplified with the R1/R2 primer pair and HaeIII (H) digestions. (B) orf1-orf3 intergenic polymorphisms displayed by PCR with the P5/P6 primer pair. (C) Genomic map of the cfiA gene cluster and surrounding regions. Numbers in parentheses indicate %GC of sequence elements. See the text for accession numbers.

