
FIG. 1.
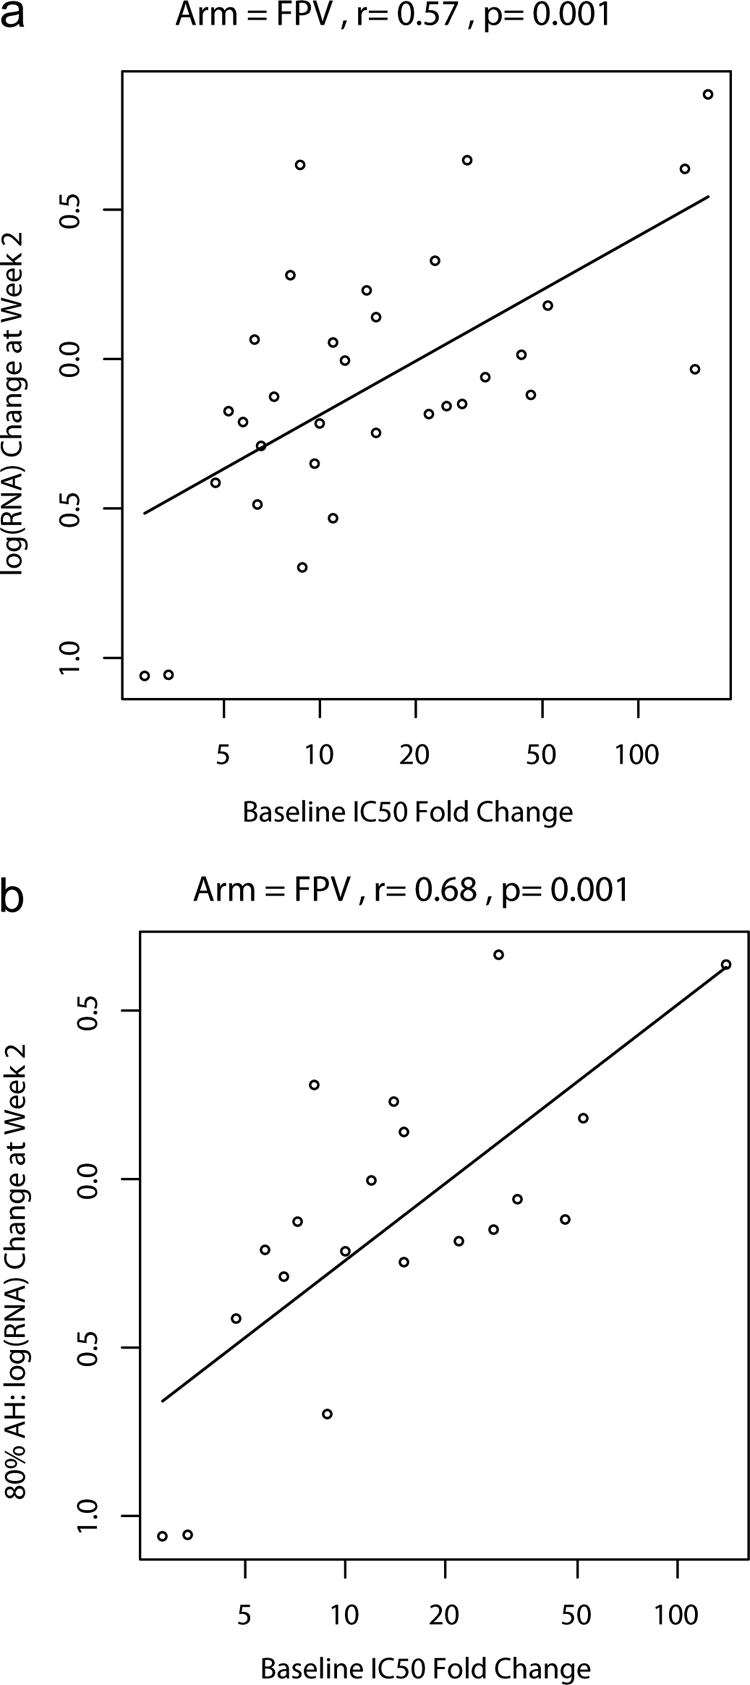
(a) Plot of log RNA change versus IC50 FC (on a loge scale) and estimated log RNA change as a function of IC50 FC (linear regression model). (b) Plot of log RNA change versus IC50 FC (on a loge scale) and estimated log RNA change as a function of IC50 FC for subjects with at least 80% adherence (AH) (linear regression model).