
FIG. 1.
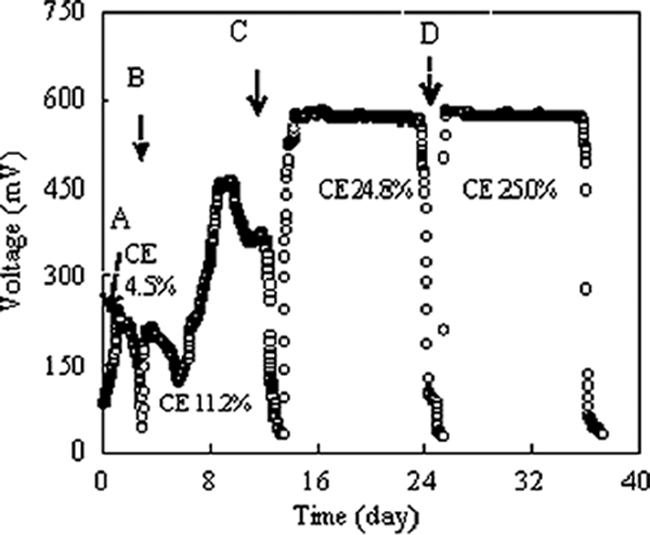
Voltage output as a function of time from the initial hydrolysate concentration of 1,000 mg COD/liter. A, first transfer; B, second transfer; C, third transfer; D, fourth transfer. The CEs of the transfers (A to D) were 4.5%, 11.2%, 24.8%, and 25.0%, respectively.