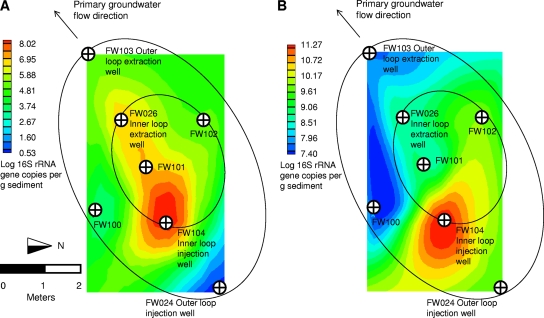
FIG. 2.
Spatial representation of Anaeromyxobacter (TAna probe) (A) and total bacterial (B) 16S rRNA gene abundances at the Oak Ridge IFC site area 3, based on qPCR analysis of samples from seven wells. Circles schematically represent the inner and outer recirculation loops, based on tracer studies and hydrologic models (28). FW100, FW101, and FW102 are multiport sampling wells.

