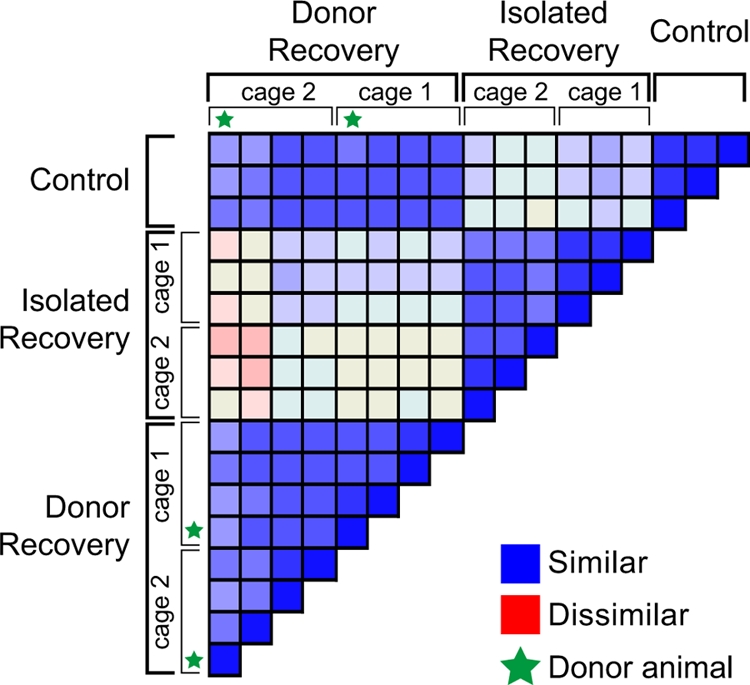
FIG. 4.

Comparison of microbial communities in cefoperazone-treated animals. More than 300,000 V6 sequence tags were retrieved from the ceca of cefoperazone-treated mice that recovered from drug treatment in the presence or absence of an untreated “donor” animal. Taxonomic assignments at the genus level were provided for the tags, and the pairwise Bray-Curtis distance was calculated for all possible comparisons. The Bray-Curtis values are presented in a heat map fashion as a color-coded distance matrix, with the most similar communities (Bray-Curtis similarity, 1.0) represented by blue and the most dissimilar communities (Bray-Curtis similarity, 0.0) represented by red. The housing of the animals is indicated, and each animal that served as a “donor” is marked with a star.
