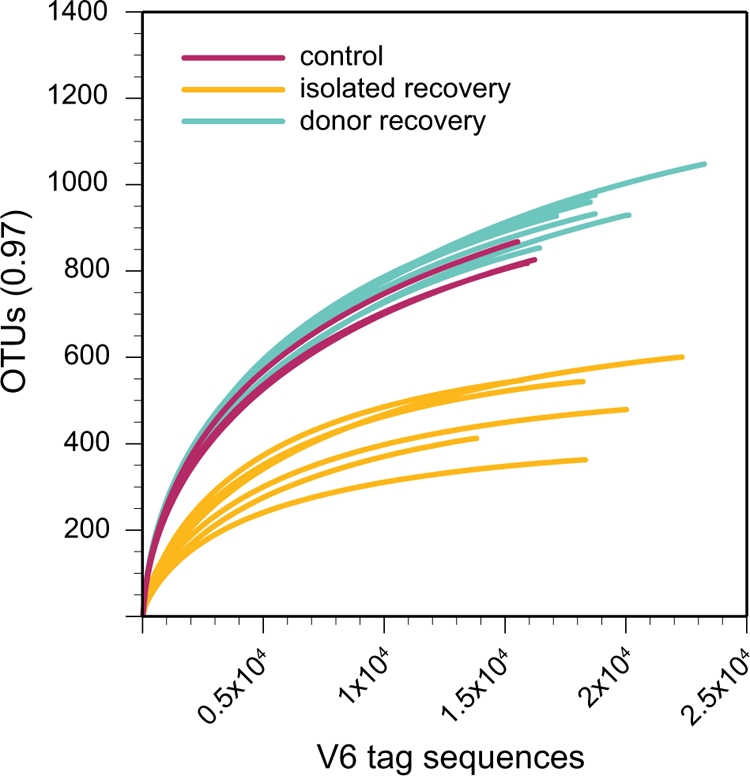
FIG. 6.

Rarefaction analysis of microbial communities from cefoperazone-treated animals. The number of assigned phylotypes is plotted as a function of the number of tags retrieved. The V6 tags from untreated animals (control), animals that recovered without an untreated animal (isolated recovery), and animals that recovered in the presence of an untreated animal (donor recovery) were used to construct rarefaction curves with an OTU definition of >97% sequence similarity.
