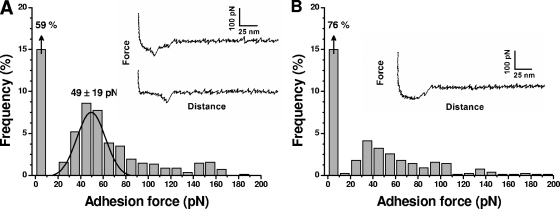
FIG. 5.
Single-molecule force spectroscopy of the IsdA-loricrin interaction. (A) Representative force curves and an adhesion force histogram (n = 853) obtained in PBS between an IsdA tip and a loricrin support, using approach and retraction speeds of 1,000 nm/s and an interaction time of 500 ms. Similar data were obtained with more than 10 different tips and independent supports. (B) The same experiment as that described for panel A was performed, except that a BSA-terminated support was used instead of a loricrin support.

