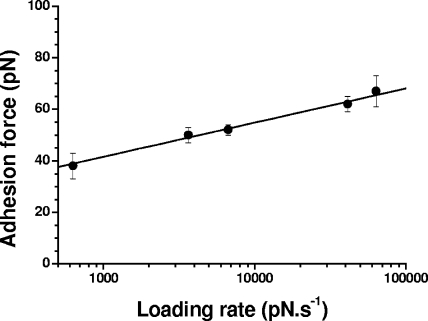
FIG. 6.
Dynamics of the IsdA-loricrin interaction. Shown is a plot of the adhesion force as a function of the logarithm of the loading rate applied during retraction, while keeping constant the interaction time (500 ms) and the approach speed (1,000 nm/s). Data represent the means of 100 measurements, and the bars indicate standard errors from the means.

